Interested In Learning the Traits of FXCM’s Successful Traders? If So, Click Here
Talking Points:
-USD/CAD Technical Strategy: Still Not Worth Fighting The Trend
-ST Support Remains At Weekly Pivot Of 1.3875
-Positively Correlated US Oil Could Continue To Push This Pair Higher Still
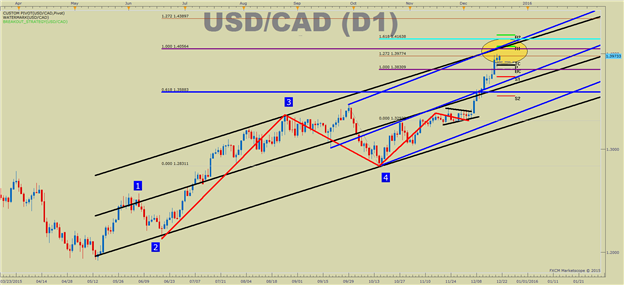
From the opening range low of December of 1.3292, USD/CAD has pushed higher by over 700 pips to a high of 1.4001. The high for the month, so far, has aligned to the 2004 high of 1.4001 to the pip. However, the occurrence should not be confused with a topping signal. To give you an indication of the strength of this move, since we posted the December opening range low on December 3, USD/CAD has only had one-day close in the red. When momentum is this strong, the environment for a reversal is difficult, and when that is combined with the sentiment picture, we will continue to favor USD/CAD higher.
The chart below explains the technical picture of USD/CAD with few retracements into the recent price range near 1.4000. Short-term support this month has been found at the weekly pivot before attempts at the weekly R1 & R2 surface. The channel drawn on the USD/CAD daily chart is a regression channel in black starting with the May low. Currently, the price sits right below the extension of the least-squares regression line off the August high. This upper-line tells us that we’re seeing an extended move, but sentiment extremes can lead to extended moves extending. A tighter price channel is drawn with Andrew’s pitchfork in blue drawn from key price extremes in September-October, and the channel shows the price could still move higher. The zone of resistance in focus is between 1.4050 and 1.4163, which is 100% Fib Expansion of labeled wave ‘3’, and the 1.618% expansion of the move from the late October low respectively.
Because FX is relative, it is important to know that sayings something is overbought is a relative notion. If Oil continues to fall, the Canadian dollar will likely continue to weaken as traders begin to price in the Bank of Canada moving into a dovish stance as well as GDP downgrade. At least, when looking at the chart below, the trend should be favored continuing if the price remains above the Weekly Pivot point & S1, currently 1.3876-1.3752 respectively. Currently, any moves toward this zone can be seen as an opportunity to buy USD-CAD at a good risk: reward, with a stop on a close below the Weekly S1 at 1.3752.
>
original source
