Talking Points:
- Pending Test of 50% Fib Level
- Bearish RSI Divergence Signals
- High-Risk, High-Reward Trade Profile
It’s important to keep the longer-term picture for USDCAD in mind when looking at the pair in the shorter term, because despite the significant rally over the past two months or so, the pair is nowhere near its post-2008 highs.
USDCAD used to trade as high as 1.30 as recently as 2009, and while this most recent rally has probably taken the pair closer to its “fair value”—a concept we covered here back in November—the rate at which the rally has occurred may leave the pair vulnerable to a pullback.
See also: An Underrated New Catalyst Fueling USD/CAD
Now, the daily chart of USDCAD is approaching a key 50% Fibonacci level representing the midpoint of the decline from the highs at 1.3062 to the lows at 0.9430. This is a range that took more than two years to create, and this 50% Fib level should provide some resistance.
Guest Commentary: USD/CAD Facing Key 50% Resistance
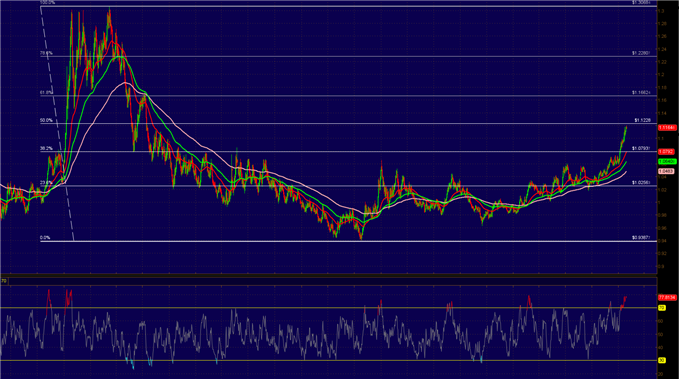
In addition, with the daily RSI significantly overbought (over 77), and with the four-hour RSI (see below four-hour chart) showing significant divergence, caution is warranted for those trading the long side in USDCAD.
Guest Commentary: Bearish RSI Divergence in USD/CAD
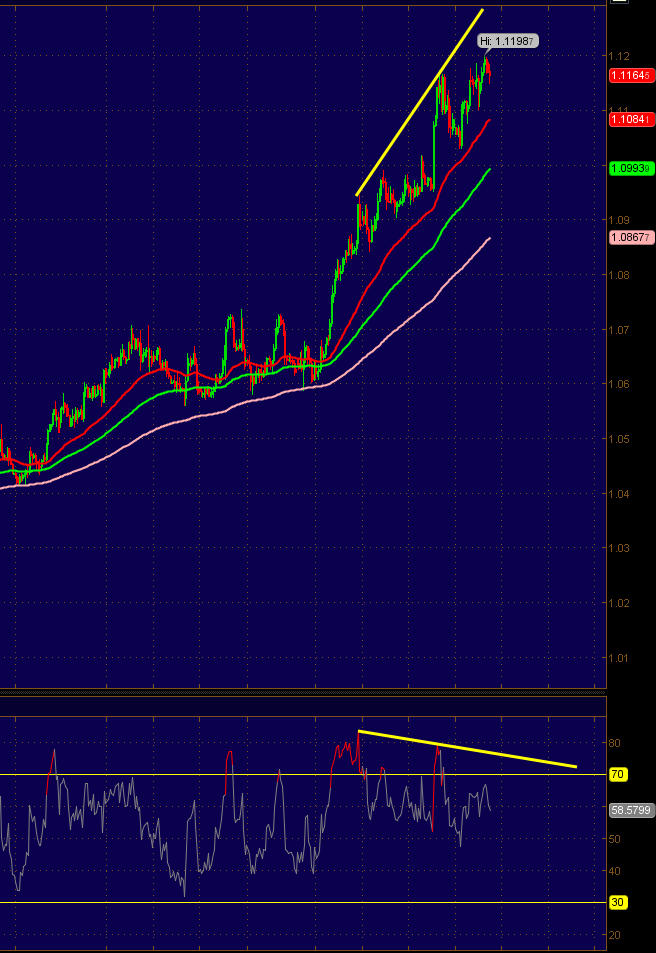
Be advised that shorting such a powerful uptrend is a risky play, but it could pay off handsomely if we finally see some profit taking by CAD bears around this key 50% Fib level.
By Liam McMahon, Currency Strategist, GlobalFxClub.com
original source


