“I am pleased to announce results for Riot for 2023, which proved to be another milestone year in Riot’s ongoing development as a leading vertically integrated Bitcoin miner,” said
“In addition to our record financial performance in 2023, Riot achieved significant progress across our key strategic development targets, including: (i) completion of our 700 megawatt Rockdale Facility expansion; (ii) successful scaling of our power strategy, which drove our industry-leading low cost to mine in FY 2023 to
“At the same time, Riot has also further enhanced our already industry-leading balance sheet strength, ending 2023 with approximately
Fiscal Year 2023 Financial and Operational Highlights
Key financial and operational highlights for the fiscal year ended
- Total revenue of
$280.7 million , as compared to$259.2 million for the same period in 2022, primarily driven by higher Bitcoin production and higher price for Bitcoin. - Earned
$71.2 million in power credits through support of theERCOT grid inTexas during several weather-related supply/demand issues in 2023. The amount of power credits earned equated to approximately 2,497 Bitcoin, as computed by using average daily closing Bitcoin prices on a monthly basis. - Produced 6,626 Bitcoin, as compared to 5,554 during the same twelve-month period in 2022, a 19% increase, notwithstanding the impact of the Company’s effective employment of its power strategy, under which Bitcoin production was suspended while the Company received significant benefits from power credits earned.
- Bitcoin Mining revenue of
$189.0 million , as compared to$156.9 million during the same twelve-month period in 2022. The increase in Bitcoin Mining revenue was driven by slightly higher values of Bitcoin mined in 2023, which averaged$28,859 per Bitcoin as compared to an average price of$28,245 per Bitcoin in 2022, as well as more Bitcoin mined in 2023 from an increase in miners deployed. - Data Center Hosting revenue of
$27.3 million , as compared to$36.9 million for the same twelve-month period in 2022. The decrease is primarily attributable to the termination of certain hosting agreements during the period. - Engineering revenue of
$64.3 million , as compared to$65.3 million for the same twelve-month period in 2022. - Reported a net loss of
$49.5 million , as compared to a net loss of$509.6 million in the same period in 2022, which was significantly impacted by non-cash impairment charges totaling$538.6 million in 2022. - Reported non-GAAP Adjusted EBITDA of
$214.0 million in 2023 which included a$184.7 million gain on Bitcoin held on the balance sheet. InDecember 2023 , the FASB issued ASU 2023-08, under which, Riot recognizes its Bitcoin held at fair value, with changes in the fair value recognized in income. Riot elected to early adopt this guidance in 2023. - Maintained industry–leading financial position, with
$887.6 million in net working capital, including$597.2 million in cash on hand, nominal long-term debt, and 7,362 Bitcoin, all of which were produced by the Company’s self-mining operations, as ofDecember 31, 2023 . - Riot’s cost to mine Bitcoin for 2023, net of power credits allocated to self-mining, averaged
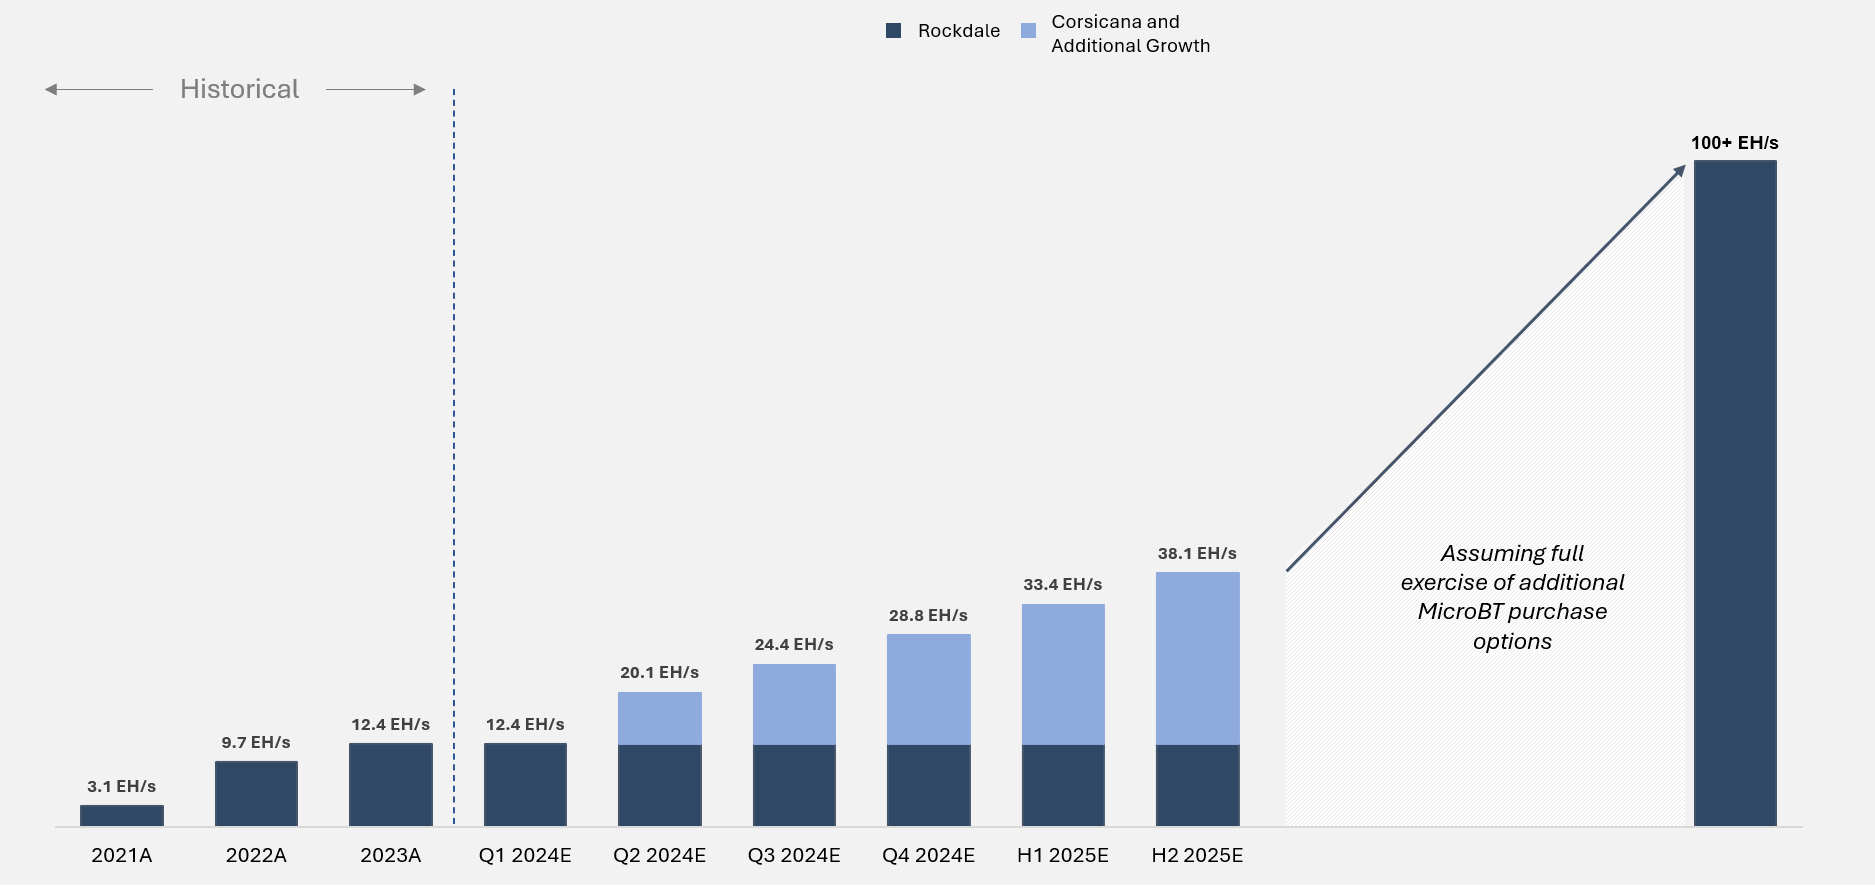
$7,539 per Bitcoin versus$11,225 in 2022, a decrease of 33% year-over-year. - Increased hash rate capacity by 28% to 12.4 exahash per second (“EH/s”) as of
December 31, 2023 , compared to 9.7 EH/s as ofDecember 31, 2022 .
Fiscal Year 2023 Financial Results
Total revenue for the year ended
Bitcoin Mining revenue in excess of mining cost of revenue for the year ended
Data Center Hosting cost in excess of revenue for the year ended
Engineering revenue in excess of engineering cost of revenue for the year ended
Under Riot’s long-term power agreements, the Company has the ability to return unused power and receive power credits at market-driven spot prices. Power credits received from these activities totaled
If power credits were directly allocated between Bitcoin Mining cost of revenue and Data Center Hosting cost of revenue based on proportional power consumption, Bitcoin Mining cost of revenue would have decreased by
Selling, general and administrative expenses during the year ended
Net loss for 2023 was
Non-GAAP Adjusted EBITDA for the twelve-month period ended
Hash Rate Growth
Riot plans to energize the first building (
At this pace, Riot’s self-mining hash rate is expected to grow from 12.4 EH/s to over 28 EH/s by the end of 2024. Phase II of the Corsicana Facility will bring two additional buildings online by the end of 2025, increasing total self-mining hash rate to over 38 EH/s.
About
Riot’s (NASDAQ: RIOT) vision is to be the world’s leading Bitcoin-driven infrastructure platform.
Our mission is to positively impact the sectors, networks and communities that we touch. We believe that the combination of an innovative spirit and strong community partnership allows the Company to achieve best-in-class execution and create successful outcomes.
Riot is a Bitcoin mining and digital infrastructure company focused on a vertically integrated strategy. The Company has Bitcoin mining operations in central
For more information, visit www.riotplatforms.com.
Safe Harbor
Statements in this press release that are not historical facts are forward-looking statements that reflect management’s current expectations, assumptions, and estimates of future performance and economic conditions. Such statements rely on the safe harbor provisions of Section 27A of the Securities Act of 1933 and Section 21E of the Securities Exchange Act of 1934. Because such statements are subject to risks and uncertainties, actual results may differ materially from those expressed or implied by such forward-looking statements. Words such as “anticipates,” “believes,” “plans,” “expects,” “intends,” “will,” “potential,” “hope,” and similar expressions are intended to identify forward-looking statements. These forward-looking statements may include, but are not limited to, statements about the benefits of acquisitions, including financial and operating results, and the Company’s plans, objectives, expectations, and intentions. Among the risks and uncertainties that could cause actual results to differ from those expressed in forward-looking statements include, but are not limited to: unaudited estimates of Bitcoin production; our future hash rate growth (EH/s); the anticipated benefits, construction schedule, and costs associated with the
For further information, please contact:
Investor Contact:
IR@Riot.Inc
303-794-2000 ext. 110
Media Contact:
303-794-2000 ext. 118
PR@Riot.Inc
SOURCE:
Non-GAAP Measures of Financial Performance
In addition to financial measures presented under generally accepted accounting principles in
Adjusted EBITDA is provided in addition to and should not be considered to be a substitute for, or superior to, net income, the most comparable measure under GAAP to Adjusted EBITDA. Further, Adjusted EBITDA should not be considered as an alternative to revenue growth, net income, diluted earnings per share or any other performance measure derived in accordance with GAAP, or as an alternative to cash flow from operating activities as a measure of our liquidity. Adjusted EBITDA has limitations as an analytical tool, and you should not consider this financial measure either in isolation or as a substitute for analyzing our results as reported under GAAP.
The following table reconciles Adjusted EBITDA to Net income (loss), the most comparable GAAP financial measure:
| Years Ended | ||||||||||||
| 2023 | 2022 | 2021 | ||||||||||
| Net income (loss) | $ | (49,472 | ) | $ | (509,553 | ) | $ | (15,437 | ) | |||
| Interest (income) expense | (8,222 | ) | (454 | ) | 296 | |||||||
| Income tax expense (benefit) | (5,093 | ) | (11,749 | ) | 254 | |||||||
| Depreciation and amortization | 252,354 | 107,950 | 26,324 | |||||||||
| EBITDA | 189,567 | (413,806 | ) | 11,437 | ||||||||
| Adjustments: | ||||||||||||
| Stock-based compensation expense | 32,170 | 24,555 | 68,491 | |||||||||
| Acquisition-related costs | — | 78 | 21,198 | |||||||||
| Change in fair value of derivative asset | (6,721 | ) | (71,418 | ) | (12,112 | ) | ||||||
| Change in fair value of contingent consideration | — | (159 | ) | 975 | ||||||||
| Realized gain on sale/exchange of long-term investment | — | — | (26,260 | ) | ||||||||
| Realized loss on sale of marketable equity securities | — | 8,996 | — | |||||||||
| Unrealized (gain) loss on marketable equity securities | — | — | 13,655 | |||||||||
| Loss (gain) on sale/exchange of equipment | 5,336 | (16,281 | ) | — | ||||||||
| Casualty-related charges (recoveries), net | (5,974 | ) | 9,688 | — | ||||||||
| Impairment of goodwill | — | 335,648 | — | |||||||||
| Impairment of miners | — | 55,544 | — | |||||||||
| Other (income) expense | (260 | ) | 59 | (2,378 | ) | |||||||
| License fees | (97 | ) | (97 | ) | (97 | ) | ||||||
| Adjusted EBITDA | $ | 214,021 | $ | (67,193 | ) | $ | 74,909 | |||||
In addition to Adjusted EBITDA , we believe “Bitcoin Mining revenue in excess of cost of revenue, net of power curtailment credits”, “Data Center Hosting revenue in excess of cost of revenue, net of power curtailment credits”, “Cost of revenue – Bitcoin Mining, net of power curtailment credits” and “Cost of revenue – Data Center Hosting, net of power curtailment credits” are additional non-GAAP performance metrics that represent a key indicator of the Company’s core business operations of both Bitcoin Mining and Data Center Hosting.
We believe our ability to offer power back to the grid at market-driven spot prices, thereby reducing our operating costs, is integral to our overall strategy, specifically our power management strategy and our commitment to supporting the
We also believe netting power credits against our costs can be an important financial measure because it allows management, investors, and our board of directors to evaluate and compare our operating results, including our operating efficiencies, from period-to-period by making such adjustments. We have allocated the benefit of the power sales to our Bitcoin Mining and Data Center Hosting segments based on their proportional power consumption during the periods presented.
Bitcoin Mining revenue in excess of cost of revenue, net of power curtailment credits, Data Center Hosting revenue in excess of cost of revenue, net of power curtailment credits, Cost of revenue – Bitcoin Mining, net of power curtailment credits and Cost of revenue – Data Center Hosting, net of power curtailment credits are provided in addition to and should not be considered to be a substitute for, or superior to Revenue – Bitcoin Mining, Revenue – Data Center Hosting, Cost of revenue – Bitcoin Mining or Cost of revenue – Data Center Hosting as presented in our Consolidated Statements of Operations.
The following table presents reconciliations of these non-GAAP performance metrics to the most comparable GAAP financial measures:
| Years Ended | ||||||||||||
| 2023 | 2022 | 2021 | ||||||||||
| Bitcoin Mining | ||||||||||||
| Revenue (A) | $ | 188,996 | $ | 156,870 | $ | 184,422 | ||||||
| Cost of revenue | 96,597 | 74,335 | 45,513 | |||||||||
| Bitcoin Mining revenue in excess of cost of revenue (B) | 92,399 | 82,535 | 138,909 | |||||||||
| Power curtailment credits allocated to Bitcoin Mining | 46,646 | 11,991 | — | |||||||||
| Bitcoin Mining revenue in excess of cost of revenue, net of power curtailment credits (C) | $ | 139,045 | $ | 94,526 | $ | 138,909 | ||||||
| Bitcoin Mining revenue in excess of cost of revenue, as a percentage of revenue (B/A) | 48.9 | % | 52.6 | % | 75.3 | % | ||||||
| Bitcoin Mining revenue in excess of cost of revenue, net of power curtailment credits, as a percentage of revenue (C/A) | 73.6 | % | 60.3 | % | 75.3 | % | ||||||
| Data Center Hosting | ||||||||||||
| Revenue (A) | $ | 27,282 | $ | 36,862 | $ | 24,546 | ||||||
| Cost of revenue | 97,122 | 61,906 | 32,998 | |||||||||
| Data Center Hosting revenue in excess of cost of revenue (B) | (69,840 | ) | (25,044 | ) | (8,452 | ) | ||||||
| Power curtailment credits allocated to Data Center Hosting | 24,569 | 15,354 | 6,514 | |||||||||
| Data Center Hosting revenue in excess of cost of revenue, net of power curtailment credits (C) | $ | (45,271 | ) | $ | (9,690 | ) | $ | (1,938 | ) | |||
| Data Center Hosting revenue in excess of cost of revenue, as a percentage of revenue (B/A) | (256.0 | )% | (67.9 | )% | (34.4 | )% | ||||||
| Data Center Hosting revenue in excess of cost of revenue, net of power curtailment credits, as a percentage of revenue (C/A) | (165.9 | )% | (26.3 | )% | (7.9 | )% | ||||||
| Allocation of Power Curtailment Credits | ||||||||||||
| Consolidated power curtailment credits | 71,215 | 27,345 | 6,514 | |||||||||
| Percentage of consolidated power curtailment credits allocated to Bitcoin Mining | 65.5 | % | 43.9 | % | 0.0 | % | ||||||
| Percentage of consolidated power curtailment credits allocated to Data Center Hosting | 34.5 | % | 56.1 | % | 100.0 | % | ||||||
A photo accompanying this announcement is available at https://www.globenewswire.com/NewsRoom/AttachmentNg/91efab5f-81fa-45ab-9f19-10ad51d2a2d6

![]()
Graph

Graph
2024 GlobeNewswire, Inc., source


