| PERFORMANCE INDICATOR | UNIT | CALENDAR 2020 YEAR | HALF YEAR1 | SEPTEMBER 2021 QUARTER | DECEMBER 2021 QUARTER | HALF YEAR | CALENDAR 2021 YEAR1 |
| Gold recovered | Ounces | 260,045 | 191,246 | 112,786 | 128,378 | 241,164 | 432,410 |
| Gold poured | Ounces | 257,592 | 191,510 | 110,535 | 126,948 | 237,483 | 428,993 |
| Production Cost | US$/ounce | 871 | 894 | 857 | 823 | 839 | 863 |
| All-In Site Cost (AISC) | US$/ounce | 1,002 | 1,030 | 966 | 934 | 949 | 985 |
| Gold sales | Ounces | 265,127 | 194,114 | 107,650 | 130,486 | 238,136 | 432,250 |
| Average sales price | US$/ounce | 1,579 | 1,6421 | 1,655 | 1,669 | 1,663 | 1,653 |
| Notional Cashflow | US$ million | 150.0 | 103.31 | 77.8 | 94.0 | 171.8 | 275.11 |
Notes: 1. Includes Yaouré cost and sales data from
- Key Operating highlights include:
- Gold production increased 14% quarter-on-quarter to 128,378 ounces or 66% year-on-year to 432,410 ounces.
- Weighted average AISCs decreased by 3% or
US$32 quarter-on-quarter toUS$934 per ounce or 5% year-on-year toUS$985 per ounce. - Gold production of 241,164 ounces and AISC of
US$949 per ounce, comfortably achieved market guidance for the December Half Year of 225 - 255,000 ounces of gold atUS$925 -1,025 per ounce. - Quarterly gold sales increased by 21%, giving a 63% increase in year-on-year gold sales to 432,250 ounces.
- Average quarterly cash margin of
US$735 per ounce of gold wasUS$46 more than prior quarter. - Notional cashflow from operations increased by 21% quarter-on-quarter to
US$ 94.0 million , and 84% year-on-year to$275.1 million . - Operating performance consistently in line with ESG KPIs.
- Perseus’s strong operating performance is forecast to continue with production of 230,000 to 265,000 ounces at an ASIC of
US$915 toUS$1,085 per ounce planned in theJune 2022 Half Year, translating to 471,000 to 506,000 ounces at an ASIC ofUS$932 toUS$1,020 per ounce for the full 2022 Financial Year.
- Business development activities continued to deliver encouraging results, demonstrating potential to materially increase Perseus’s Ore Reserves inventory and extend the economic mine lives of its operations:
- Exploration programmes on the Nkosuo prospect near Edikan and the CMA Underground prospect at Yaouré both returned excellent drill results, confirming the potential for strong organic growth of each mine.
- Assessment of inorganic growth opportunities continue to generate encouraging results.
- Perseus’s financial position continues to strengthen with available cash and bullion of
US$212 million (A$292 million), debt ofUS$50 million (A$68 million), and net cash ofUS$162 million (A$269 million) at31 December 2021 , after returningUS$13 million (A$18 million) of capital to shareholders, reducing debt byUS$50 million (A$68 million ) and investingUS$11 million (A$15 million ) in organic growth during the quarter.
OPERATIONS
QUARTERLY PRODUCTION, COSTS AND NOTIONAL CASHFLOW
Perseus’s three operating gold mines, Yaouré and Sissingué in Côte d’Ivoire, and Edikan in
This performance contributed to Half Yearly gold production at our three mines of 241,164 ounces of gold, produced at an average AISC of
Table 1: Cost and Production Summary by Mine
| MINE | TOTAL GOLD PRODUCED (OUNCES) | ALL-IN SITE COST (US$/OUNCE) | ||||
| SEPTEMBER 2021 QUARTER | QUARTER | HALF YEAR | QUARTER | QUARTER | HALF YEAR | |
| Yaouré | 64,558 | 75,189 | 139,747 | 671 | 700 | 687 |
| Edikan | 32,161 | 35,124 | 67,285 | 1,574 | 1,450 | 1,509 |
| Sissingué | 16,067 | 18,065 | 34,132 | 931 | 905 | 917 |
| 112,786 | 128,378 | 241,164 | 966 | 934 | 949 | |
Combined gold sales from all three operations totalled 130,486 ounces, 21% more than last quarter. The weighted average gold price realised was
Table 2: Realised Gold Price and Notional Cash Flow by Mine
| MINE | REALISED GOLD PRICE (US$ PER OUNCE) | NOTIONAL CASH FLOW FROM OPERATIONS (US$ MILLION) | ||||
| SEPTEMBER 2021 QUARTER | QUARTER | HALF YEAR | SEPTEMBER 2021 QUARTER | QUARTER | HALF YEAR | |
| Yaouré | 1,690 | 1,699 | 1,695 | 65.8 | 75.1 | 140.9 |
| Edikan | 1,602 | 1,613 | 1,608 | 0.9 | 5.7 | 6.6 |
| Sissingué | 1,624 | 1,638 | 1,631 | 11.1 | 13.2 | 24.3 |
| 1,655 | 1,669 | 1,663 | 77.8 | 94.0 | 171.8 | |
YAOURÉ GOLD MINE, CÔTE D’IVOIRE
During the quarter, Perseus’s newest mine, Yaouré, increased its gold production by a further 16% compared to the prior quarter to 75,189 ounces of gold at a production cost of
This performance contributed to half yearly gold production at Yaouré of 139,747 ounces of gold, produced at an average AISC of
The improving operating performance at Yaouré was a result of strong operating fundamentals compared to the prior quarter, including mill throughput rates (487 tph compared to 449 tph), gold recovery rates (93.6% compared to 92.7%) and importantly, the head grade of processed ore (2.64 g/t to 2.37 g/t).
Table 3: Yaouré Quarterly Performance
| PARAMETER | UNIT | CALENDAR 2020 YEAR | HALF YEAR2 | QUARTER | QUARTER | HALF YEAR | 2021 CALENDAR YEAR TO DATE2 |
| Gold Production & Sales | |||||||
| Total material mined | Tonnes | 6,449,440 | 16,979,488 | 6,340,478 | 9,870,283 | 16,210,761 | 33,190,249 |
| Total ore mined | Tonnes | 128,148 | 659,620 | 1,070,285 | 1,378,535 | 2,448,820 | 3,108,440 |
| Average ore grade | g/t gold | 0.78 | 1.23 | 2.07 | 1.98 | 2.02 | 1.85 |
| Strip ratio | t:t | 49.3 | 24.74 | 4.92 | 6.16 | 5.62 | 9.68 |
| Ore milled | Tonnes | 122,545 | 1,462,177 | 913,530 | 946,052 | 1,859,582 | 3,321,759 |
| Milled head grade | g/t gold | 1.01 | 1.40 | 2.37 | 2.64 | 2.51 | 2.02 |
| Gold recovery | % | 67.7 | 90.01 | 92.7 | 93.6 | 93.2 | 92.3 |
| Gold produced | ounces | 2,687 | 59,438 | 64,558 | 75,189 | 139,747 | 199,185 |
| Gold sales1 | ounces | - | 54,182 | 60,055 | 79,669 | 139,724 | 193,906 |
| Average sales price | US$/ounce | - | 1,692 | 1,690 | 1,699 | 1,695 | 1,694 |
| Unit Production Costs | |||||||
| Mining cost | US$/t mined | - | 2.71 | 2.95 | 2.56 | 2.71 | 2.71 |
| Processing cost | US$/t milled | - | 9.90 | 13.74 | 13.52 | 13.63 | 11.99 |
| G & A cost | US$M/month | - | 1.70 | 1.89 | 2.08 | 1.99 | 1.89 |
| All-In Site Cost | |||||||
| Production cost | US$/ounce | - | 951 | 572 | 589 | 581 | 659 |
| Royalties | US$/ounce | - | 83 | 85 | 90 | 87 | 86 |
| Sub-total | US$/ounce | - | 1,033 | 657 | 679 | 669 | 745 |
| Sustaining capital | US$/ounce | - | 3 | 14 | 21 | 18 | 15 |
| Total All-In Site Cost3 | US$/ounce | - | 1,036 | 671 | 700 | 687 | 760 |
| Notional Cashflow from Operations2 | |||||||
| Cash Margin | US$/ounce | - | 648 | 1,019 | 999 | 1,008 | 934 |
| Notional Cash Flow | US$M | - | 24.2 | 65.8 | 75.1 | 140.9 | 165.1 |
Notes:
1. Gold sales are recognised in Perseus’s accounts when gold is delivered to the customer from Perseus’s metal account
2. Includes Yaouré data from declaration of Commercial Production on
3. Included in the AISC for the quarter is
MINERAL RESOURCE TO MILL RECONCILIATION
The reconciliation of processed ore tonnes, grade and contained gold relative to the Yaouré Mineral Resource block model are shown in Table 4. During the last quarter, 17% more ore tonnes at 10% lower grade for 6% more ounces have been produced compared to the Mineral Resource model. Over the last six months and project to-date, Yaouré has produced more metal than predicted by the Mineral Resource model. The performance of the Yaouré Mineral Resource model to date is considered satisfactory, however work will continue to optimise the grade and reduce dilution.
Table 4: Yaouré
| PARAMETER | BLOCK MODEL TO MILL CORRELATION FACTOR | |||||
| 3 MONTHS | 6 MONTHS | PROJECT TO DATE | ||||
| Tonnes of Ore | 117 | % | 114 | % | 109 | % |
| Head Grade | 90 | % | 97 | % | 99 | % |
| Contained Gold | 106 | % | 110 | % | 108 | % |
SISSINGUÉ GOLD MINE, CÔTE D’IVOIRE
During the quarter, 18,065 ounces of gold were produced at Sissingué at a production cost of
This performance contributed to half yearly gold production at Sissingué of 34,132 ounces of gold, produced at an average AISC of
The overall result for the quarter at Sissingué, was also better than forecast by Perseus with each of the key operating parameters including runtime (95%), throughput rate (178 tph), and recovery (90%) improving relative to the prior quarter. Average head grade (1.67g/t) was down relative to the prior quarter in line with company expectations.
Table 5: Sissingué Quarterly Performance
| PARAMETER | UNIT | CALENDAR 2020 YEAR | HALF YEAR | SEPTEMBER 2021 QUARTER | QUARTER | HALF YEAR | CALENDAR 2021 YEAR |
| Gold Production & Sales | |||||||
| Total material mined | Tonnes | 5,144,335 | 1,738,136 | 395,727 | 706,459 | 1,102,186 | 2,840,322 |
| Total ore mined | Tonnes | 1,681,633 | 851,552 | 162,912 | 186,063 | 348,975 | 1,200,527 |
| Average ore grade | g/t gold | 2.20 | 2.13 | 1.52 | 0.87 | 1.17 | 1.85 |
| Strip ratio | t:t | 2.1 | 1.0 | 1.4 | 2.8 | 2.2 | 1.4 |
| Ore milled | Tonnes | 1,349,807 | 596,416 | 299,757 | 375,615 | 675,372 | 1,271,788 |
| Milled head grade | g/t gold | 2.41 | 2.70 | 1.91 | 1.67 | 1.78 | 2.23 |
| Gold recovery | % | 94.9 | 92.6 | 87.1 | 89.8 | 88.5 | 90.9 |
| Gold produced | ounces | 99,268 | 48,763 | 16,067 | 18,065 | 34,132 | 82,895 |
| Gold sales1 | ounces | 95,765 | 55,519 | 18,250 | 16,621 | 34,870 | 90,389 |
| Average sales price | US$/ounce | 1,606 | 1,670 | 1,624 | 1,638 | 1,630 | 1,655 |
| Unit Production Costs | |||||||
| Mining cost | US$/t mined | 4.72 | 6.20 | 9.62 | 6.80 | 7.81 | 6.80 |
| Processing cost | US$/t milled | 15.98 | 18.8 | 19.4 | 16.90 | 18.01 | 18.40 |
| G & A cost | US$M/month | 1.05 | 1.05 | 1.24 | 1.20 | 1.22 | 1.14 |
| All-In Site Cost1 | |||||||
| Production cost | US$/ounce | 589 | 580 | 830 | 817 | 823 | 680 |
| Royalties | US$/ounce | 79 | 107 | 94 | 85 | 89 | 100 |
| Sub-total | US$/ounce | 668 | 687 | 924 | 902 | 912 | 780 |
| Sustaining capital | US$/ounce | 24 | 28 | 7 | 3 | 5 | 18 |
| Total All-In Site Cost | US$/ounce | 692 | 715 | 931 | 905 | 917 | 798 |
| Notional Cashflow from Operations1 | |||||||
| Cash Margin | US$/ounce | 927 | 956 | 693 | 732 | 713 | 856 |
| Notional Cash Flow | US$M | 92.0 | 46.6 | 11.1 | 13.2 | 24.3 | 71.0 |
Notes: 1. Gold sales are recognised in Perseus’s accounts when gold is delivered to the customer from Perseus’s metal account.
MINERAL RESOURCE TO MILL RECONCILIATION
The reconciliation of processed ore tonnes, grade and contained ounces relative to the Sissingué Mineral Resource block model is in Table 6 below. During the last three months, grade control has predicted similar tonnes (100%) grade (99%) and ounces (99%) when compared to the Mineral Resource Estimate (MRE). Over the last six- and 12-month periods of operation, Sissingué has produced more metal than predicted by the Mineral Resource model. Perseus regards the overall outperformance as being within normal industry standards.
Table 6: Sissingué
| PARAMETER | BLOCK MODEL TO MILL CORRELATION FACTOR | |||||
| 3 MONTHS | 6 MONTHS | 1 YEAR | ||||
| Tonnes of Ore | 100 | % | 116 | % | 108 | % |
| Head Grade | 99 | % | 105 | % | 103 | % |
| Contained Gold | 99 | % | 121 | % | 107 | % |
UPDATED LIFE OF MINE PLAN FOR THE SISSINGUÉ OPERATION
An updated Life of Mine Plan for the Sissingué operation that models the mining and processing of ore from each of the Sissingué, Fimbiasso and the yet to be granted, Bagoé exploitation permit areas, is being prepared and will be published in the
BAGOÉ
Work by consultants (CECAF), on preparing an Environmental and Social Impact Assessment (ESIA) for the Bagoé exploration permit area was completed during the quarter. The ESIA has been lodged with the environmental regulator (ANDE) for approval. Once approval is granted, it will be lodged with the
EDIKAN GOLD MINE,
In the
While the overall performance of Edikan was materially better than in the September quarter, there is still significant room for improvement. Signs of this improvement were evident in the month of December when the mill feed was made up predominantly of ore from the
This quarterly performance contributed to Half Yearly gold production at Edikan of 67,285 ounces of gold, produced at an average AISC of
The shortfall in production relative to guidance was a function of several factors including poor reconciliation of tonnes and grade of ore mined from the AG pit in the
Table 7: Edikan Quarterly Performance
| PARAMETER | UNIT | CALENDAR 2020 YEAR | HALF YEAR | SEPTEMBER 2021 QUARTER | DECEMBER 2021 QUARTER | DECEMBER 2021 HALF YEAR | CALENDAR 2021 YEAR |
| Gold Production & Sales | |||||||
| Total material mined | Tonnes | 27,056,108 | 14,829,935 | 7,823,678 | 7,589,717 | 15,413,395 | 30,243,330 |
| Total ore mined | Tonnes | 4,379,485 | 1,968,783 | 788,612 | 836,266 | 1,624,878 | 3,593,661 |
| Average ore grade | g/t gold | 1.24 | 1.08 | 0.92 | 0.90 | 0.91 | 1.01 |
| Strip ratio | t:t | 5.2 | 6.5 | 8.9 | 8.1 | 8.5 | 7.4 |
| Ore milled | Tonnes | 6,787,946 | 3,280,435 | 1,731,146 | 1,756,072 | 3,487,218 | 6,767,653 |
| Milled head grade | g/t gold | 1.01 | 0.93 | 0.72 | 0.73 | 0.73 | 0.82 |
| Gold recovery | % | 71.7 | 85.0 | 80.2 | 85.6 | 83.0 | 84.1 |
| Gold produced | ounces | 158,090 | 83,045 | 32,161 | 35,124 | 67,285 | 150,330 |
| Gold sales1 | ounces | 169,362 | 84,412 | 29,345 | 34,196 | 63,541 | 147,953 |
| Average sales price | US$/ounce | 1,564 | 1602 | 1,602 | 1,613 | 1,608 | 1,604 |
| Unit Production Costs | |||||||
| Mining cost | US$/t mined | 3.13 | 3.22 | 3.36 | 3.45 | 3.41 | 3.32 |
| Processing cost | US$/t milled | 9.05 | 9.60 | 8.56 | 8.23 | 8.39 | 8.98 |
| G & A cost | US$M/month | 1.64 | 1.39 | 1.78 | 2.04 | 1.89 | 1.63 |
| All-In Site Cost2 | |||||||
| Production cost | US$/ounce | 1,048 | 1,054 | 1,445 | 1,327 | 1,383 | 1,201 |
| Royalties | US$/ounce | 107 | 106 | 98 | 105 | 102 | 104 |
| Sub-total | US$/ounce | 1,155 | 1,160 | 1,543 | 1,432 | 1,485 | 1,305 |
| Sustaining capital | US$/ounce | 42 | 53 | 32 | 18 | 24 | 40 |
| Total All-In Site Cost2 | US$/ounce | 1,197 | 1,213 | 1,574 | 1,450 | 1,509 | 1,345 |
| Notional Cashflow from Operations1 | |||||||
| Cash Margin | US$/ounce | 370 | 389 | 28 | 163 | 98 | 259 |
| Notional Cash Flow | US$M | 58.4 | 32.3 | 0.9 | 5.7 | 6.6 | 38.9 |
Notes:
1. Gold sales are recognised in Perseus’s accounts when gold is delivered to the customer from Perseus’s metal account.
2. Included in the AISC for the quarter is
MINERAL RESOURCE TO MILL RECONCILIATION
The disconnect in the Edikan reconciliation has been analysed in detail to understand the performance to ensure that the trend will not continue in the Stage 3 cutback of the
Additional drilling has been undertaken this quarter to confirm the continuity of the grade and geology. The drilling assays returned emulated the block model grades giving good confidence in the ongoing cutback ore content and has enhanced the geological model. The Edikan Block Model to mill reconciliation figures are shown in Table 8 below.
Table 8: Edikan Block Model to Mill Reconciliation
| PARAMETER | BLOCK MODEL TO MILL CORRELATION FACTOR | |||||
| 3 MONTHS | 6 MONTHS | 1 YEAR | ||||
| Tonnes of Ore | 78 | % | 87 | % | 89 | % |
| Head Grade | 81 | % | 84 | % | 87 | % |
| Contained Gold | 63 | % | 73 | % | 77 | % |
GROUP GOLD PRODUCTION AND COST MARKET GUIDANCE
Table 9: Production and Cost Guidance
| PARAMETER | UNITS | (ACTUAL) | (FORECAST) | 2022 FINANCIAL YEAR (FORECAST) |
| Yaouré | ||||
| Production | Ounces | 139,747 | 130,000 - 140,000 | 269,747 - 279,747 |
| All-in Site Cost | USD per ounce | 687 | 765 to 815 | 725 to 750 |
| Sissingué | ||||
| Production | Ounces | 34,133 | 25,000 to 35,000 | 59,133 – 69,133 |
| All-in Site Cost | USD per ounce | 917 | 810 to 1,280 | 872 to 1,100 |
| Production | Ounces | 67,284 | 75,000 to 90,000 | 142,284 – 157,284 |
| All-in Site Cost | USD per ounce | 1,509 | 1,210 to 1,430 | 1,350 to 1,465 |
| PERSEUS GROUP | ||||
| Production | Ounces | 241,164 | 230,000 to 265,000 | 471,164 – 506,164 |
| All-in Site Cost | USD per ounce | 949 | 915 to 1,085 | 932 to 1,020 |
SUSTAINABILITY
COVID-19 UPDATE
A fourth wave of COVID-19 has spread across
During the quarter 60 new cases of COVID-19 were recorded, mainly at the Edikan and Yaouré operations and almost all in the month of December. Vaccination campaigns progressed across our operations, and with increased vaccine availability across the region, around 50 per cent of Perseus’s employees and contractors are now fully vaccinated. Efforts continue to improve vaccination rates as they become available under government programs.
SUSTAINABILITY GOVERNANCE
During the quarter, Perseus continued to strengthen its sustainability governance by:
- Releasing the second Modern Slavery Statement in line with the Australian Modern Slavery Act 2018 (Cth), for the period
1 July 2020 to30 June 2021 , providing further information on the human rights risk profile of Perseus’s global supply chain, and outlining its human rights and modern slavery due diligence program. - Commencing a global project to transform Perseus’s health and safety approach and performance across the operations in line with international best practice, focusing on leadership, culture, capability and risk management. The work will be delivered throughout the remainder of FY22 and FY23.
- Commencing an independent review of closure plans and cost estimates, to be completed by the end of Q3.
- Updating security risk assessments at Sissingué due to the increased terrorism risks in countries to the north of Côte d’Ivoire associated with activity of Jihadist groups in the Sahel region.
SUSTAINABILITY PERFORMANCE
This quarter, Perseus continued its strong sustainability performance relative to objectives and targets, as shown below in Table 10 and summarised as follows:
- Safety: Perseus’s record of zero fatalities across the operations was maintained, and safety performance improved significantly from the previous quarter at Edikan and Sissingué, with Total Recordable Injury Frequency Rates (TRIFR) to the end of December 1.36 and 0.0 respectively. The TRIFR across the Group was 1.49, a significant improvement on the September quarter and our FY21 performance, however still higher than our FY22 target of 1.3. Sissingué achieved 1 year without a recordable incident, and Edikan was awarded the Best Performer in
Occupational Health and Safety during the 7th Ghana Mining Industry Awards, established by the Ghana Chamber of Mines. - Social:
- Total economic contribution to Perseus’s host countries of
Ghana and Côte d’Ivoire for the financial year to date of around US$223 million (around 60% of revenue), included approximately US$166 million paid to local suppliers, US$21 million paid as salaries and wages to local employees, US$35 million in payments to government as taxes, royalties and other payments, and around US$591,000 in social investment. - Local and national employment has been maintained at above 95% for the quarter, and local procurement around 81%.
- Zero significant community events occurred.
- Total economic contribution to Perseus’s host countries of
- Environment:
- Scope 1 and 2 greenhouse gas emissions remained steady from the first quarter. Water intensity increased slightly due to dry season conditions across the region.
- As part of development of Perseus’s emissions reduction strategy, two vendors were shortlisted to support further detailed studies to partially replace the diesel fired back-up generators at Yaouré with solar power.
- Zero environmental events or significant tailings dam integrity issues occurred during the period.
In achieving the above, the following sustainability challenges were encountered by Perseus during the quarter:
- Total Recordable Injury Frequency Rates (TRIFR) at Yaouré increased from 3.24 in the September quarter to 3.49, tracking significantly higher than its FY21 result of 1.59 and higher than its FY22 target of 2.2. Given its performance and the significant work required to embed Perseus’s Health and Safety standards at this new operation, Yaouré will be the primary focus of the Health and Safety improvement program for the remainder of FY22.
- Government administrative delays to the establishment of the Yaouré Community Development Fund, and associated delays to commencement of community projects. Perseus is working with Government to establish the fund as soon as possible, and community funding is being accumulated in an account each month since commercial production was achieved at Yaouré.
- Illegal mining activities on Perseus’s mining and exploration licence areas continues to present challenges for the Company in both
Ghana and Côte d’Ivoire. The Company continues to work closely with relevant government authorities to manage these activities that have proven to negatively impact both the environmental and social fabric of local communities. - Ongoing tensions with the community around Yaouré regarding employment and business opportunities and land compensation.
- Security risks at Sissingué and satellite exploration activity areas (Fimbiasso and Bagoé) are being closely monitored due to ongoing political and social unrest which has given rise to terrorist activities in
Mali which lies immediately to the north of the Sissingué mine.
Table 10: Sustainability Quarterly Performance
| PERFORMANCE DRIVER | SUB-AREA | METRIC | UNIT | FY2021 | |||
| Governance | Compliance | Material legal non-compliance | Number | 0 | 0 | 0 | |
| Social | Workplace fatalities | Number | 0 | 0 | 0 | ||
| Total Recordable Injury Frequency (TRIF) | Total Recordable Injuries per million hours worked, rolling 12 months | Edikan - 1.49 Sissingué - 1.47 Yaouré - 1.59 Exploration - 1.92 Group - 1.76 | Edikan - 1.89 Sissingué - 0.50 Yaouré - 3.24 Exploration - 2.80 Group - 1.85 | Edikan - 1.36 Sissingué - 0.00 Yaouré - 3.49 Exploration - 2.01 Group - 1.49 | |||
| Lost Time Injury Frequency (LTIFR) | Lost Time Injuries (LTIFR) per million hours worked, rolling 12 months | Edikan - 0.37 Sissingué - 0.00 Yaouré - 1.59 Exploration - 0.00 Group - 0.45 | Edikan - 0.38 Sissingué - 0.00 Yaouré - 0.991 Exploration - 1.40 Group - 0.46 | Edikan - 0.39 Sissingué - 0.00 Yaouré - 0.76 Exploration - 1.00 Group - 0.46 | |||
| COVID-19 Cases | Number | 24 | 66 | 60 | |||
| Community | Number of significant2 community events | Number | 21 | 0 | 0 | ||
| Community investment | US$ | ||||||
| Economic Benefit | Proportion local and national employment | % of total employees | 95% | 95% | 96% | ||
| Proportion local and national procurement | % of total procurement | 81% | 74% | 81% | |||
| Gender Diversity | Board gender diversity | % | 33% | 33% | 33% | ||
| Executive gender diversity | % | 40% | 40% | 40% | |||
| Proportion of women employees | % | 14.7%3 | 13.8%3 | 12.0%3 | |||
| Responsible Operations | Environment | Number of significant2 environmental events | Number | 0 | 0 | 0 | |
| Tailings | Number of significant2 tailings dam integrity failures | Number | 0 | 0 | 0 | ||
| Water stewardship | Water used per ounce of gold produced | M3/oz | 13.8 | 6.91 | 8.05 | ||
| Greenhouse Gas Emissions | Scope 1 and 2 Greenhouse Gas Emissions per ounce of gold produced | Tonnes of CO2-e/oz | 0.63 | 0.57 | 0.57 | ||
Notes:
- Corrected/re-stated figure from the
September 2021 Quarter report - A significant event is one with an actual severity rating of four and above, based on Perseus's internal severity rating scale (tired from one to five by increasing severity) as defined in our Risk Management Framework
- Permanent employees only.
BUSINESS GROWTH
CÔTE D’IVOIRE EXPLORATION
YAOURÉ EXPLORATION & EXPLOITATION PERMITS
Exploration activities during the quarter on the Yaouré exploitation permit focused on drilling at the CMA underground and CMA Down-dip Extension prospects, both within two kilometres of the Yaouré mill. Other programs included auger drilling at Degbezere (Appendix 1 – Figure 1.1). In all, 7,828 metres of RC and 23,398 metres of diamond core were drilled at CMA and CMA Down-dip during the quarter.
Work at the CMA Underground prospect focused on infill drilling to firm up previously defined underground resources extending below the currently planned CMA pit. Perseus defined an Inferred Mineral Resource of 1.8 million tonnes grading 6.1 g/t Au, extending to a maximum 275 metre down dip beneath the open pit resource (refer Resources and Reserves ASX announcement dated
Drilling on the CMA structure expanded towards the northern end, beyond the drilling during the previous quarter that focused on the lower grade southern end of the structure due to operational demands. Drilling during the quarter comprised 21,015 metres in 67 Reverse Circulation (“RC”) pre-collared diamond (“DD”) holes, continuing the infill of the existing 50 x 50 metre coverage to a nominal 25 x 25 metre pattern to allow conversion of the Inferred resource to Indicated. Results to date from the infill drilling program have been encouraging, with intercepts generally consistent with those previously encountered in both thickness and grade.
Step-out drilling to investigate the next 300 metre down-dip from the current CMA Underground resource also continued, with 10,211 metres drilled in 18 RC pre-collared DD holes focused in the area around the explosives magazine. The step-out program is guided by the 2020 3D seismic survey that clearly identified the CMA structure extending to depth beyond the current drill coverage. Drilling is being undertaken on an initial 100 x 200 metre pattern to better define the position of the CMA structure and the intensity of mineralisation. If results are encouraging, this will be infilled to 100 x 100 metres to allow an initial Inferred Mineral Resource Estimate. The results from the CMA Underground infill and extension drilling continue to demonstrate the potential for the Company to materially grow its gold inventory at Yaouré organically, as is more fully detailed in the Company’s ASX release dated
On the Yaouré West exploration permit auger geochemical drilling was undertaken along the Degbezere NE trend, with 732 metres drilled in 81 holes. The augering covers the
Results from the Aircore (“AC”) program conducted in the previous quarter were received but with generally negative results.
BAGOÉ EXPLORATION PERMIT
Limited drilling was conducted on the Bagoé permit during the
In addition to the drilling, ground magnetic surveys were conducted over the Ludivine and Brigitte areas, data from which is being assessed.
AGYAKUSU OPTION
Exploration drilling continued throughout the December quarter at the Nkosuo prospect on the Agyakusu permit north of the Company’s
Drilling now underway at Nkosuo will focus on extending 80 x 80 metre over the still open southern extension of the granite, completing the 40 x 40 metres coverage and ultimately infilling to 40 x 20 metres to support a planned Mineral Resource estimate to be completed early in the
In anticipation that this work will lead to a positive outcome the Company is in the process of exercising its option over the Agyakusu permit.
AGYAKUSU-DML OPTION
A planned AC drilling program to test gold-in-soil anomalism along the main structural/intrusive corridor extending SW from the Nkosuo prospect on the adjoining Agyakusu permit has been deferred in favour of an initial lower impact auger program (Appendix 1 - Figure 1.4). This work will commence during the next quarter.
DOMENASE OPTION
Planned first-pass soil sampling covering the main structural/intrusive corridors on this property was delayed pending renewal of the permit and finalisation of a new option agreement.
EXPLORATION EXPENDITURE
Expenditure on exploration activities throughout
Table 11:
| REGION | UNITS | CALENDAR 2020 YEAR | HALF YEAR | SEPTEMBER 2021 QUARTER | DECEMBER 2021 QUARTER | DECEMBER 2021 HALF YEAR | CALENDAR 2021 YEAR |
| US$ million | 3.03 | 0.85 | 2.14 | 4.13 | 6.27 | 7.12 | |
| Côte d’Ivoire | |||||||
| Sissingué | US$ million | 3.81 | 4.41 | 1.10 | 0.53 | 1.63 | 6.04 |
| Yaouré | US$ million | 11.65 | 5.95 | 4.16 | 6.09 | 10.25 | 16.20 |
| Regional | US$ million | 1.27 | 0.19 | 0.25 | 0.01 | 0.26 | 0.45 |
| Sub-total | US$ million | 16.73 | 10.55 | 5.52 | 6.62 | 12.14 | 22.69 |
| Total | US$ million | 19.76 | 11.40 | 7.66 | 10.75 | 18.42 | 29.82 |
GROUP FINANCIAL POSITION
CASHFLOW AND BALANCE SHEET (UNAUDITED)
Perseus achieved yet another strong quarter of cash generation, with a
Based on the spot gold price of
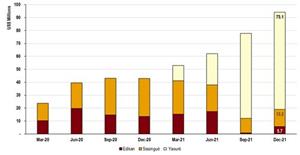
The graph below (Figure 1) shows the notional operating cash flows from the three mines, the largest single driver of cash movement, and how this compares historically over the past 2 years. Note that “Notional Operating Cash Flow” is obtained by multiplying average sales price less AISC (the “notional margin”) by the ounces of gold recovered.
Figure 1: Notional Operating Cashflow is available at https://www.globenewswire.com/NewsRoom/AttachmentNg/a392e58b-8f3a-4201-a0b3-b32765c9365c
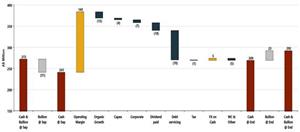
The overall movement in cash and bullion during the quarter is shown below in Figure 2. Aside from the operating margin, other relevant movements are, Australian and West African corporate costs (
Figure 2: Quarterly Cash and Bullion Movements is available at https://www.globenewswire.com/NewsRoom/AttachmentNg/0787d92f-c94f-4a8e-9995-d49262cb0983
GOLD PRICE HEDGING
At the end of the quarter, Perseus held gold forward sales contracts for 209,657 ounces of gold at a weighted average sales price of
Perseus’s hedge position has increased by 672 ounces since the end of the
Hedging contracts currently provide downside price protection to approximately 21% of Perseus’s currently forecast gold production for the next three years, leaving 79% of forecast production potentially exposed to movements (both up and down) in the gold price.
- 18 January – Edikan Exploration Update
- 19 January – Yaouré Exploration Update
- 23 February– Half Year Financial Results
- 31 March – Sissingué Life of Mine Update
This market announcement was authorised for release by the board of
COMPETENT PERSON STATEMENT:
All production targets referred to in this report are underpinned by estimated Ore Reserves which have been prepared by competent persons in accordance with the requirements of the JORC Code.
Edikan. The information in this report that relates to AF Gap Mineral Resources and Ore Reserve estimate was first reported by the Company in a market announcement “Perseus Mining Updates Mineral Resources and Ore Reserves” released on
Sissingué, Fimbiasso, Bagoé. The information in this report that relates to Mineral Resource and Ore Reserve estimates for the Fimbiasso deposits was first reported by the Company in a market announcement “Perseus Mining Updates Mineral Resources and Ore Reserves” released on
Yaouré. The information in this report that relates to
The information in this report relating to exploration results was first reported by the Company in compliance with the JORC Code 2012 and NI43-101 in market updates “Perseus Achieves Near-Mine Exploration Success in Ghana” released on
CAUTION REGARDING FORWARD LOOKING INFORMATION:
This report contains forward-looking information which is based on the assumptions, estimates, analysis and opinions of management made in light of its experience and its perception of trends, current conditions and expected developments, as well as other factors that management of the Company believes to be relevant and reasonable in the circumstances at the date that such statements are made, but which may prove to be incorrect. Assumptions have been made by the Company regarding, among other things: the price of gold, continuing commercial production at the Yaouré
| ASX/TSX CODE: PRU CAPITAL STRUCTURE: Ordinary shares: 1,233,044,570 Performance rights: 21,325,392 REGISTERED OFFICE: Level 2 Subiaco WA 6008 Telephone: +61 8 6144 1700 Email: IR@perseusmining.com www.perseusmining.com | DIRECTORS: Mr Non-Executive Chairman Mr Managing Director & CEO Ms Non-Executive Director Mr Non-Executive Director Mr Non-Executive Director Mr Non-Executive Director Non-Executive Director | CONTACTS: Managing Director & CEO jeff.quartermaine@perseusmining.com Corporate Communications +61 414 558 202 claire.hall@perseusmining.com Media Relations +61 4 20 582 887 nathan.ryan@nwrcommunications.com.au |
APPENDIX 1 – FIGURES
Figure 1.1: Yaouré
Figure 1.2: Sissingué
Figure 1.3: Bagoé
Figure 1.4:

![]()
Figure 1
Notional Operating Cashflow
Figure 2
Quarterly Cash and Bullion Movements
Figure 1.1
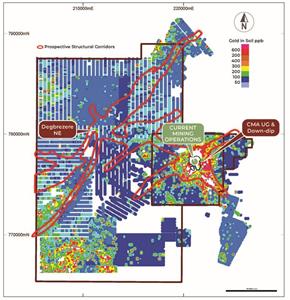
Yaouré Gold Project – Tenements and Prospects
Figure 1.2

Sissingué Gold Mine and Bagoé Project – Tenements and Prospects
Figure 1.3
Bagoé Gold Project – Main Prospects
Figure 1.4

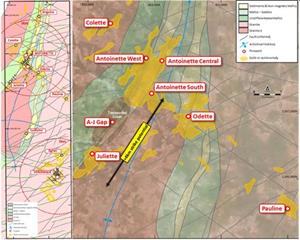
Edikan Gold Mine – Regional Geology, Tenements and Prospects
2022 GlobeNewswire, Inc., source


