The updated PEA demonstrates that with low initial capex, the Falchani project has the potential to become a substantial, low-cost, long-life producer of high purity Lithium Carbonate (“LCE” or “Li2CO3”) with the potential to also produce Sulfate of Potash (“SOP”) and Cesium Sulfate (“CsS” or “Cs2SO4”) by-products alongside LCE. The PEA base case envisions 32 years of mining followed by 11 years of stockpile processing over the potential life of mine (“LOM”). The PEA alternative case is identical, but with added production of high purity SOP and Cesium sulfate as by-products from Years 6-43 alongside the initial expansion. All dollar figures are in US currency.
Falchani PEA Highlights (Base Case – LCE only production):
- Pre-tax Net Present Value (“NPV”)8%
$8.41 billion at$22,500 /tonne (“t”) LCE - After-tax NPV8%
$5.11 billion at$22,500 /t LCE- NPV has tripled versus 2019 PEA After-tax NPV8%
$1.5 billion at$12,000 /t LCE
- NPV has tripled versus 2019 PEA After-tax NPV8%
- Pre-tax Internal Rate of Return (“IRR”) of 40.7%
- After-tax IRR of 32.0%
- Pre-tax initial capital payback period 2.5 years; after-tax payback 3.0 years
- Average LOM annual pre-tax cash flow:
$1,019 million ; annual after-tax cash flow:$ 644 million - Initial Capital Costs (“Capex”) estimated at
$681 million - Total Capex LOM estimated at
$2,565 million ; Sustaining Capital estimated at$236 million - Operating cost (“Opex”) estimated at
$5,092 /t LCE - PEA mine and processing plan produces 2.64 Mt LCE LOM over 43 years
Steady-state Ave. of 23,145 tpa LCE Phase 1; 45,084 tpa Phase 2; and 72,624 tpa Phase 3
In this PEA, we showcase the existing potential for high annual production and long mine-life at Falchani, yet the deposit resource currently remains open to the north and west with the potential for further resource / mine-life expansion. The low operating cost potential at Falchani with costs of less than
Falchani PEA Highlights Alternate Case – LCE-only in Phase 1; SOP + Cs2SO4 added from Phase 2:
- Identical LCE production scenario, but with added average production of 81,556 tpa of SOP and 3,796 tpa of Cs2SO4 from Years 6-43
- Pre-tax NPV8%
$9.25 billion at$22,500 /t LCE,$1,000 /t SOP &$58,000 /t Cs2SO4 - After-tax NPV8%
$5.58 billion at$22,500 /t LCE,$1,000 /t SOP &$58,000 /t Cs2SO4 - Pre-tax Internal Rate of Return (“IRR”) of 38.5%
- After-tax IRR of 29.9%
- Pre-tax initial capital payback period 2.5 years; after-tax payback 3.0 years
- Average LOM pre-tax annual cash flow (excluding initial capital):
$1,227 million ; annual after-tax cash flow:$ 774 million - Initial Capital Costs (“Capex”) estimated at
$681 million - Total Capex estimated at
$3,466 million ; Sustaining Capital estimated at$260 million - Opex estimated at
$5,705 /t LCE (for all products) - Opex estimated at
$1,361 /t LCE, inclusive of SOP & Cs2SO4 credits - PEA mine plan produces 2.64 Mt LCE and 3.10 Mt SOP and 144,247 t Cs2SO4 LOM over 43 years
- Simple drill, blast, truck and shovel open pit mining of the near-surface, high-grade (>2,700 ppm Li) resource the scalable, long-life, lithium project producing approximately 23 ktpa LCE over Years 1-5, expanding to 45 ktpa LCE production for Years 6-10 years followed by Phase 3 expansion producing ~84 ktpa for Years 11-32 when mining ceases. Rehandling of the <2,700 ppm Li stockpile allows production to continue for Years 33-43, averaging 44.8 ktpa over this period.
- Average LOM Production of approximately 61,400 tpa of 99.5% LCE for 43 years.
- Targeted >2,700 ppm Li grade pit-constrained resource supports mining for 32 years and processing <2,700 ppm Li stockpile for an additional 11 years.
- LOM Strip Ratio (Waste:Ore) of 0.60:1 after accounting for processed stockpile material
- Sulfuric acid leaching using industry standard techniques and flowsheet produces high purity lithium carbonate to enable the production of battery grade LC.
- Sulfate of Potash is an important fertilizer product for specialty crops, especially those grown in
Peru (ex. avocado, blueberries, grapes & coffee) with a growing global market. SOP production from Falchani has the potential to satisfy Peru’s domestic needs with additional export possibility. - Cesium is used in high-pressure, high-temperature offshore oil and gas drilling and is used in infrared detectors, optics, photoelectrical cells, scintillation counters and spectrometers. Isotopes of cesium are atomic clocks necessary for aircraft guidance systems, global positioning satellites, and internet and cell phone applications. Cesium sulfate produced at Falchani can be further refined by third parties into desired end-products.
Table 1 – Falchani Project PEA Key Highlights
| Description | Units | Base Case | Alternate Case |
| LCE Selling Price | $/tonne | ||
| Life of Mine | years | 43 | 43 |
| Processing Rate P1 / P2 / P31 | ROM Mtpa | 1.5/3.0/6.0 | 1.5/3.0/6.0 |
| Average Throughput (LOM) | tpa | 4,946,898 | 4,946,898 |
| LCE Produced (average LOM)1 | tpa | 61,386 | 61,386 |
| P1 LCE Production (Yr 1-5 steady state) | tpa | 23,000 | 23,000 |
| P2 LCE Production (Yr 6-10 steady state) | tpa | 45,000 | 45,000 |
| P3 LCE Production (Yr 11-32 steady state) | tpa | 84,000 | 84,000 |
| P3 LCE Production (Yr 33-43 stockpile) | tpa | 44,800 | 44,800 |
| LCE Produced (total LOM)1 | tonnes | 2,639,610 | 2,639,610 |
| Unit Operating Cost (OPEX) LOM2 | $/LCE tonne | 5,092 | 1,361 |
| SOP Produced (average LOM)1 | tpa | n/a | 81,556 |
| SOP Selling Price | $/tonne | n/a | 1,000 |
| Cs2SO4 Produced (average LOM)1 | tpa | n/a | 3,796 |
| Cs2SO4 Selling Price | $/tonne | n/a | 58,000 |
| Capital Cost (CAPEX)3 P1 | $ M | 681 | 681 |
| Capital Cost (CAPEX)3 LOM | $ M | 2,565 | 3,466 |
| Sustaining Capital Costs (undiscounted) | $ M | 236 | 260 |
| Project Economics | |||
| Pre-tax: | |||
| Net Present Value (NPV) (8%) | U$ M | 8,411 | 9,251 |
| Internal Rate of Return (IRR) | % | 40.7 | 38.5 |
| Initial Payback Period (undiscounted) | years | 2.5 | 2.5 |
| Average Annual Cash Flow (LOM) | $ M | 1,019 | 1,227 |
| Cumulative Cash Flow (undiscounted) | $ M | 43,150 | 52,072 |
| After-tax:4 | |||
| Net Present Value (NPV)8%) Post-Tax | $ M | 5,109 | 5,585 |
| Internal Rate of Return (IRR) Post-Tax | % | 32.0 | 29.9 |
| Payback Period (undiscounted) | years | 3.0 | 3.0 |
| Average Annual Cash Flow (LOM) | $ M | 644 | 774 |
| Cumulative Cash Flow (undiscounted) | $ M | 27,011 | 32,597 |
Notes:
- Production: base case is 3 phases, 1.5Mtpa, 3.0Mtpa and 6.0Mtpa throughput; alternative case is identical with production of LCE-only in Phase 1, but with SOP and Cs2SO4 co-products from Phase 2 expansion onward (Years 6-43).
- Includes all operating expenditures with credit for SOP and Cs2SO4 production as offset to Unit LCE Opex, the estimate is expected to fall within an accuracy level of ±30%.
- Includes an 11% design development allowance (DDA) on process plant capital costs.
- Tax calculation is preliminary with estimates considering current applicable taxes and include: Depreciation; Workers’ Participation Tax; Mining Pension Fund; Modified
Mining Royalty Tax ; and Federal Income Taxes.
Sensitivities (Base Case)
The NPV for the project is most sensitive to LCE/metal selling price, but relatively far less sensitive to operating costs, capital costs and main reagent costs. IRR is most sensitive to capital costs and LCE/metal selling price (Figures 1 and 2, below).
Figure 1 - Base Case Post-Tax NPV8 Sensitivity Graph
Figure 2 - Base Case Post-Tax IRR Sensitivity Graph
Mining
Based on the analysis completed by DRA Global, the
Table 3 – Mining/Processing Rates
| Parameter | Unit | Value |
| Production Life | Years | 43 (includes 2-year production ramp up)1 |
| Material mined | Mt | 339.7 |
| ROM head grade to leach (Years 1-32) | ppm Li | 3,382 |
| ROM head grade to leach (Years 33-43) | ppm Li | 1,841 |
| Recovered LCE | LOM Mt | 2.63 |
| Waste | LOM Mt | 127.0 |
| Total Mineralized Material throughput | LOM Mt | 212.7 |
| Strip Ratio (LOM) | (tw:to) | 0.60 |
- 2 years construction, including 1 year Capitalized pre-production mining; 2-year production ramp-up with 75% nameplate in Year 2.
Table 4 - Detailed Capital Cost Estimates:
| Capital Costs | Phase 1 | Phase 2 | Phase 3 | LOM |
| ($ millions) | ||||
| Mining (pre-strip and capital) | 10.3 | 10.3 | 20.6 | 41.2 |
| Processing plant - Direct costs | 399.9 | 359.9 | 720.5 | 1480.3 |
| Processing plant/mine – Infrastructure | 36.3 | 32.7 | 65.5 | 134.5 |
| Bulk infrastructure1 | 35.1 | 17.6 | 35.2 | 87.9 |
| Tailings2 | 29.2 | - | 127.4 | 156.6 |
| Total Direct Costs | 510.8 | 420.5 | 969.1 | 1900.4 |
| Total Indirect Costs (Process Plant)2 | 109.7 | 98.7 | 197.4 | 405.8 |
| Contingency/DDA (Process Plant)11% | 60.1 | 54.1 | 108.2 | 222.4 |
| Closure Costs (captured in sustaining) | - | - | - | 36.0 |
| TOTAL – Li Only Base Case | 680.6 | 573.3 | 1274.7 | 2,564.6 |
| Added Plant Capex for Cs2SO4 + SOP | - | 417 | 395 | 812 |
| Added Contingency for Cs2SO4 + SOP | - | 45.9 | 43.5 | 89.4 |
| TOTAL – Li + Cs2SO4 + SOP | 680.6 | 1,036.3 | 1713.2 | 3,466.0 |
| Sustaining Capital Costs – Li only | - | - | - | 235.6 |
| Sustaining Capital Costs – Li + Cs2SO4 + SOP | - | - | - | 259.9 |
- Tailings built in phases and included in P1 capital cost estimate and sustaining capital for remaining LOM
- Includes EPCM, spares, insurances, owners’ team.
The PEA is preliminary in nature and includes inferred resources that are considered too speculative to have the economic considerations applied to them that would enable them to be categorized as mineral reserves and there is no certainty the estimates presented in the PEA will be realized.
Qualified Persons
David Alan Thompson B-Tech, Pr Cert Eng, SACMA of DRA Projects SA Pty, an Independent Qualified Person as defined by NI 43-101, has prepared or supervised the preparation of, or has reviewed and approved the scientific and technical information pertaining to mining, mine scheduling and optimization contained in this news release.
Mr. Ted O’Connor,
The PEA is preliminary in nature and includes inferred resources that are considered too speculative to have the economic considerations applied to them that would enable them to be categorized as mineral reserves and there is no certainty the estimates presented in the PEA will be realized.
In accordance with NI 43-101, the Company intends to file the completed technical report on the PEA under the Company's profile on SEDAR+ (www.sedarplus.ca) and on the Company's website within 45 days from the date of this news release.
About DRA Global Limited (ASX: DRA | JSE: DRA), as lead engineer, is a diversified global engineering, project delivery and operations management group headquartered in
About
For more information, please contact the Company at info@americanlithiumcorp.com or visit our website at www.americanlithiumcorp.com
Follow us on Facebook, Twitter and LinkedIn.
On behalf of the Board of Directors of
“Simon Clarke”
CEO & Director
Tel: 604 428 6128
Neither the
Cautionary Statement Regarding Forward Looking Information
This news release contains certain forward-looking information and forward-looking statements (collectively “forward-looking statements”) within the meaning of applicable securities legislation. All statements, other than statements of historical fact, are forward-looking statements. Forward-looking statements in this news release include, but are not limited to, statements regarding the business plans, expectations and objectives of
Photos accompanying this announcement are available at
https://www.globenewswire.com/NewsRoom/AttachmentNg/1b17cf2d-4c2a-47d2-b376-7b67940e68d2
https://www.globenewswire.com/NewsRoom/AttachmentNg/caa0c9ef-8bb8-4e1a-8b26-db5757c874b0

![]()
Figure 1
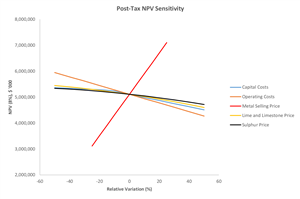
Post-Tax NPV Sensitivity
Figure 2

Post-Tax IRR Sensitivity
2024 GlobeNewswire, Inc., source


