Board Highlights Proven Turnaround Strategy Executed by New Leadership Team Since Early 2022
Erez’s Materials Demonstrate Lack of Understanding of Whitestone’s Business
Mr. Schanzer’s Indicating He Never Advocated For a "Corporate Unwind Scenario" Displays His Lack of Honesty and Transparency with Shareholders
Erez’s One-Dimensional Strategy Is an Attempt to Generate Short-Term Gains at the Expense of Long-Term Shareholder Value Creation
The full text of the letter being mailed to shareholders follows:
Dear Fellow Shareholders:
We are writing to you at a critical moment for our Company.
Whitestone has been undergoing a series of transformations since 2022, including at the Board and management level, to execute on our “reset strategy.” Under the new leadership of Independent Chairman
Our strong results were driven by the leadership’s focus on improving operating performance, the company’s balance sheet, corporate governance and transparency with our investors. Our communications with our investors, as well as independent commentary and research from the market, have strongly validated that the actions we have taken and the strategy and plan we have in place are working. We are committed to accelerating our efforts to deliver stronger profitability and long-term value for our shareholders.
But we are also concerned as a new activist, Erez Asset Management (“Erez”), threatens to disrupt our progress, derail our strategy, and destroy our momentum to generate value for our shareholders. We are not interested in tit-for-tat fight letters with Erez. But we do feel a duty to explain our perspective to shareholders, to expose the inconsistent and incoherent strategy advocated by Erez, which is focused on disrupting the work that is continuing to take place to drive value. Accordingly, we believe it is imperative to set the record straight for shareholders as they decide on the future direction of their Company.
Our Reset Strategy Is Working and Has Momentum
The last two years have been a transition period for Whitestone. The Board made the difficult decision of terminating our former CEO for cause, then naming
We are proud of Whitestone's accomplishments under our new leadership, as evidenced by:
- Strong Operations: Our occupancy reached a multi-year high of 94.2% in the fourth quarter of 2023. Our average annual same-store NOI growth since 2022 was a solid +5.3% (the third highest out of 13 shopping center REITs) 1.
- Positive Earnings Growth: Core FFO per Share has grown from
$0.86 in 2021 to$0.91 for 2023 (up nearly 6%), despite the impact of higher interest rates.
- Lower Leverage and Proactive Balance Sheet Management: We reduced leverage (measured as Net Debt / EBITDA) from 10.2x in 2020 to 7.8x for 2023. We also proactively renewed our corporate credit facility and extended its maturity to 2027. Furthermore, we have limited near-term debt maturities, with less than 10% of our debt maturing over the next two years.
- Improved Corporate Governance: We refreshed our Board with three new candidates, right-sized compensation, split the Chairman and CEO role, and provided shareholders with access to bylaws.
- Successful Resolution of Past Litigation Matters: We concluded the litigation with our former CEO (with a favorable ruling for Whitestone) and are working to monetize our stake in Pillarstone, thereby eliminating an overhang that had weighed on our stock.
The market has recognized our accomplishments:
- Superior total shareholder returns (TSR): Sector-leading +25% from the start of
Mr. Holeman's tenure throughApril 22, 2024 (#1 ranked shopping center REIT out of 13, and outperforming the MSCIU.S. REIT index, which delivered negative 16% TSR) 2. Even if we stop the measurement period right before the “Bloomberg leak” onOctober 26, 2023 , we still outperform most peers (ranked #2 out of 13 with flat total returns) and the MSCIU.S. REIT index (which delivered negative 27% TSR).
Outperformance over various standard measurement periods: Outperformed our peers and the MSCIU.S. REIT index over the past 1, 3 and 5-year periods 3.
- Bridged the valuation gap vs. peers: The gap in NTM FFO multiples as of year-end 2021 was 7x, it has shrunk to less than 2x currently 4.
- Recognition by
Research Analyst Community : Research analysts have positively commented on this "transformative" period for Whitestone and commended our efforts.
We are committed to keep delivering results, improving our corporate governance and maximizing shareholder value:
- Our 2024 guidance implies 11% in Core FFO per Share growth year-over-year.
- We carefully evaluate all opportunities to maximize shareholder value against our going-concern business plan. We are not opposed to selling the Company or exploring strategic alternatives if they lead to maximizing shareholder value. Upon receipt of the letter from Erez, we opted to be transparent with our shareholders and publicly shared our response to Erez on
December 13, 2023 , along with their original letter which called for a “corporate unwind”.
The Keys to Our Success and the Risks Posed by Erez’s Misguided Strategy:
Our success has been made possible by the trust, collaboration and cohesion between our Board and our management team. Unfortunately, Erez is seeking to interrupt our progress and derail our value-creation strategy by nominating two interlocked nominees with no experience in our markets, limited knowledge of our strategy, and no value-enhancing ideas.
Quite the opposite: their fixation on a "sale of assets or of the company outright" (per their letter dated
Clear evidence directly contradicts Erez’s claim that
But since Erez has now realized that “running a full company sale process” is unlikely to “achieve an optimal outcome” under existing market conditions, they are now conveniently recommending for Whitestone “not to rush into a sale”. Their inconsistency is also reflected in their ascribed value for our assets, which can be worth “at least
As part of their activist campaign and short-term focus, instead of offering value-enhancing ideas for Whitestone,
- Ignore recent positive momentum and superior total returns of Whitestone under its new leadership
- Focus primarily on actions undertaken years ago under our old CEO and his board leadership as chairman
- Distract investors from looking at their own track record of value destruction at Cedar Realty Trust (“CDR”) and RPT Realty (“RPT”)
But the facts speak for themselves and are undeniable,
Mr. Schanzer’s
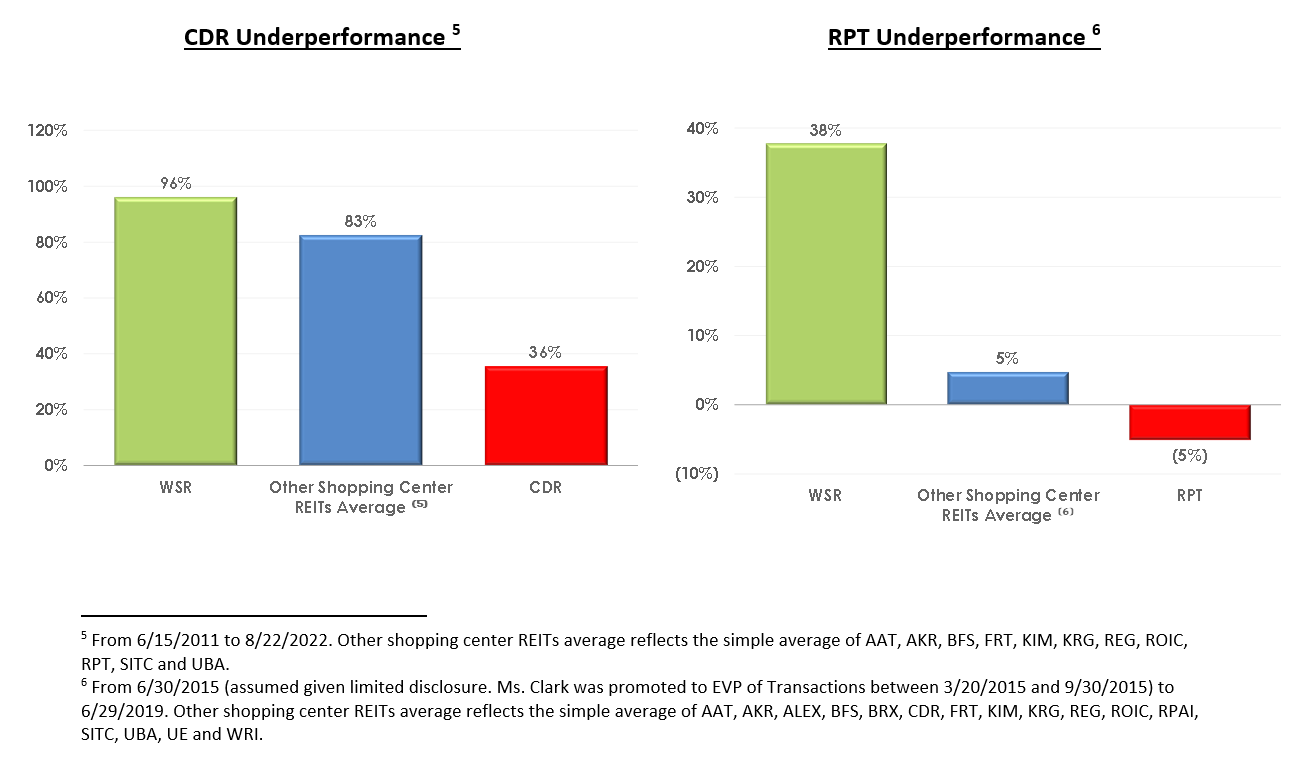
- During Mr. Schanzer’s tenure as CEO of Cedar Realty Trust, CDR total shareholder returns were +36%. Over the same period, WSR delivered +96% to its shareholders.
- CDR’s underperformance was the result of Mr. Schanzer’s strategic blunder and his fixation on development projects that CDR could not finance.
Mr. Schanzer is a self-proclaimed capital allocation expert, but could not develop a sound funding plan for his ambitious development projects at CDR.
- Right before
Mr. Schanzer announced his large-scale development strategy, CDR’s stock price was$38.15 . It sank to$16.96 within less than 2 years. After sinking his company’s stock by 56%,Mr. Schanzer indicated to the Board his intention to pursue an acquisition of CDR. Our investors should question the character and honesty of a CEO who tanks his company’s stock, and then offers to buy it from shareholders.
Cedar’s Stock Price Drops 56% Following Bruce Schanzer’s Strategic Missteps
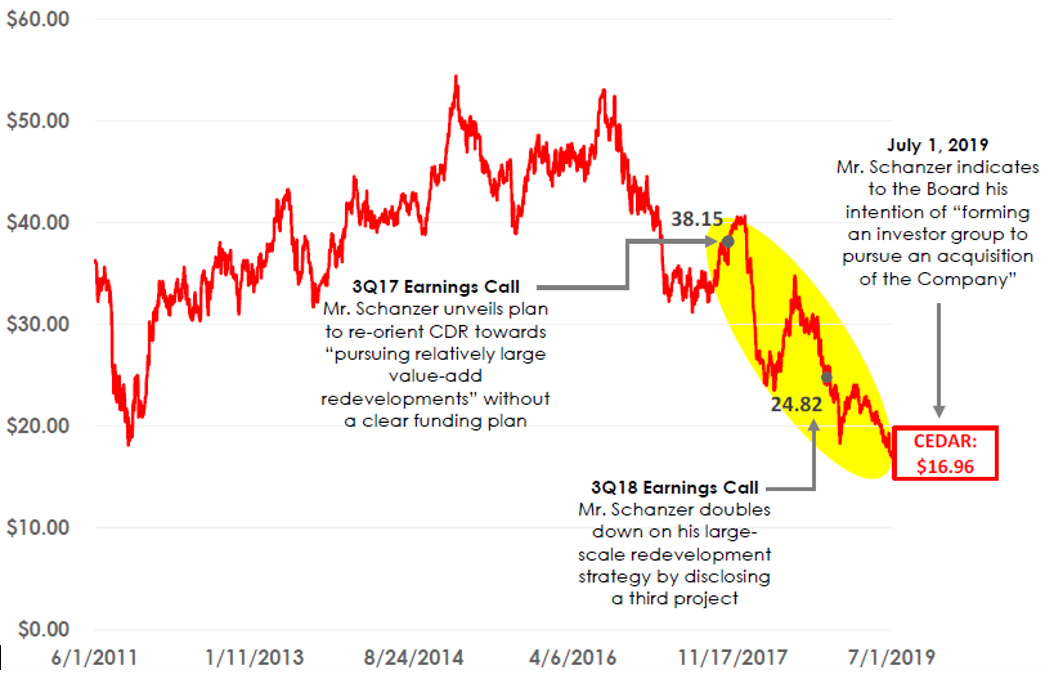
- The Company ultimately sold for
$29.00 , representing nearly a 25% discount to the price beforeMr. Schanzer announced his ambitious development strategy. Once again, our investors should carefully evaluateMr. Schanzer and his objective to replicate his strategy at CDR with your Company.
Mr. Schanzer earned a staggering$31 million pay-out at the completion of this self-motivated transaction, representing 8% of the equity value of CDR.
- The sale of CDR in
August 2022 was premised on a concept devised byMr. Schanzer , which consisted of a cram down of CDR’s preferred stock amounting to ~$160mm (at liquidation value) and of preferred shareholders (many of whom were also common shareholders) into a highly-levered, illiquid vehicle (Wheeler) – this led to significant value destruction to the preferred shareholders.
- In short, at the same time Whitestone welcomed a new leadership that decisively implemented a transformational reset strategy in early 2022,
Mr. Schanzer was engaging in a self-serving transaction that destroyed value for his company’s shareholders and employees. As summarized by JMP, A Citizen’s Company (March 18 , 2024):- “WSR’s management and board has been actively engaging with shareholders in the past two years, as part of the company’s strategy to enhance governance and provide increased transparency to investors. It has been dealing with a shareholder, Erez… looking for board representation and a company sale/liquidation. Erez is managed by
Bruce Schanzer , former President/CEO of Cedar Realty, which sold in early 2022. We view Mr. Schanzer’s tenure at Cedar as unsuccessful as the stock consistently trailed in performance. The 10-year period leading to the announcement date of Cedar’s sale (March 2022 ), saw the stock decline 22% while the broader REIT sector increased 85%”
- “WSR’s management and board has been actively engaging with shareholders in the past two years, as part of the company’s strategy to enhance governance and provide increased transparency to investors. It has been dealing with a shareholder, Erez… looking for board representation and a company sale/liquidation. Erez is managed by
Ms. Clark’s
- During Ms. Clark’s tenure as EVP-Transactions at RPT, total shareholder returns were negative 5%. Over the same period, WSR delivered +38% to its shareholders.
Ms. Clark has no experience in our markets – real estate is a local business: deep market knowledge and a broad network of connections in our markets are critical to our success.
- The two most strategic transactions executed by RPT (the GIC joint venture and the sale to Kimco) happened after
Ms. Clark had left the company.
Ms. Clark may have transacted “billions in shopping center assets” while at RPT, but the shareholder results at RPT reflect undeniable value destruction during her tenure. We at Whitestone are more careful with our acquisitions, dispositions and overall capital recycling strategy. We have built something thatMs. Clark could not at RPT: a strong portfolio of attractive shopping centers in desirable markets based on a consistent and time-tested strategy.
The Path Forward: Board Overseeing Strategy to Drive Value Creation
Our Board nominees are committed to keep Whitestone’s momentum going:
Since 2022, Whitestone has been working on a transformation at both the Board and management level to ensure the Company has the right leadership as it implements and executes on its reset strategy to generate value for our shareholders. The new Chairman
Conveniently, Erez has ignored this revitalization of Whitestone’s Board and has nominated interlocked nominees,
The choice is clear, Whitestone has a cohesive Board and Management team with a track record of value creation. In contrast, Erez is nominating two interlocked trustees with a public track record of self-dealing, underperformance and value destruction, and with the single-minded strategy to sell the Company under adverse market conditions. Erez is focused on doing what’s best for his fund and not for the Whitestone shareholders.
Your vote is critical in ensuring Whitestone’s positive momentum can continue.
Our trustee nominees are best qualified to successfully deliver Whitestone’s business plan and drive superior shareholder value.
Do not allow Erez to derail Whitestone’s positive trajectory by replacing our trustees with individuals who lack the necessary skills, have a history of value destruction, and are bent on selling your Company at the worst possible time.
Protect the value of your investment and vote the WHITE proxy card today.
1 Peers include AKR, BFS, BRX, FRT, IVT, KIM, KRG, PECO, REG, ROIC, SITC and UE. Per peer 2022 and 2023 public filings. Some differences exist in terms of peer reporting of SS NOI, including, but not limited to adjustments for prior period rents. Best efforts have been made to utilize
comparable numbers, which do not include prior period rent adjustments.
2 From
3 Represents the 1, 3 and 5-year periods ending 4/22/2024. Peers include AKR, BFS, BRX, FRT, IVT, KIM, KRG, PECO, REG, ROIC, SITC and UE.
4 NTM FFO multiples based on NTM FactSet consensus estimates as of
5 From
6 From
About
Our centers are convenience focused: merchandised with a mix of service-oriented tenants providing food (restaurants and grocers), self-care (health and fitness), services (financial and logistics), education and entertainment to the surrounding communities. The Company believes its strong community connections and deep tenant relationships are key to the success of its current centers and its acquisition strategy. For additional information, please visit www.whitestonereit.com.
Important Additional Information and Where to Find It
Certain Information Regarding Participants in Solicitation
Forward-Looking Statements
This Report contains forward-looking statements within the meaning of the federal securities laws, including discussion and analysis of our financial condition and results of operations, statements related to our expectations regarding the performance of our business, and other matters. These forward-looking statements are not historical facts but are the intent, belief or current expectations of our management based on its knowledge and understanding of our business and industry. Forward-looking statements are typically identified by the use of terms such as “may,” “will,” “should,” “potential,” “predicts,” “anticipates,” “expects,” “intends,” “plans,” “believes,” “seeks,” “estimates” or the negative of such terms and variations of these words and similar expressions, although not all forward-looking statements include these words. These statements are not guarantees of future performance and are subject to risks, uncertainties and other factors, some of which are beyond our control, are difficult to predict and could cause actual results to differ materially from those expressed or forecasted in the forward-looking statements.
Factors that could cause actual results to differ materially from any forward-looking statements made in this Report include: the imposition of federal income taxes if we fail to qualify as a real estate investment trust (“REIT”) in any taxable year or forego an opportunity to ensure REIT status; uncertainties related to the national economy, the real estate industry in general and in our specific markets; legislative or regulatory changes, including changes to laws governing REITs; adverse economic or real estate developments or conditions in
Non-GAAP Financial Measures
This release contains supplemental financial measures that are not calculated pursuant to
EBITDAre:
FFO: Funds From Operations:
Core Funds from Operations (“Core FFO”) is a non-GAAP measure. From time to time, we report or provide guidance with respect to “Core FFO” which removes the impact of certain non-recurring and non-operating transactions or other items we do not consider to be representative of our core operating results including, without limitation, default interest on debt of real estate partnership, extinguishment of debt cost, gains or losses associated with litigation involving the Company that is not in the normal course of business, and proxy contest professional fees.
Management uses FFO and Core FFO as a supplemental measure to conduct and evaluate our business because there are certain limitations associated with using GAAP net income (loss) alone as the primary measure of our operating performance. Historical cost accounting for real estate assets in accordance with GAAP implicitly assumes that the value of real estate assets diminishes predictably over time. Because real estate values instead have historically risen or fallen with market conditions, management believes that the presentation of operating results for real estate companies that use historical cost accounting is insufficient by itself. In addition, securities analysts, investors and other interested parties use FFO and Core FFO as the primary metric for comparing the relative performance of equity REITs. FFO and Core FFO should not be considered as an alternative to net income or other measurements under GAAP, as an indicator of our operating performance or to cash flows from operating, investing or financing activities as a measure of liquidity. FFO and Core FFO do not reflect working capital changes, cash expenditures for capital improvements or principal payments on indebtedness. Although our calculation of FFO is consistent with that of NAREIT, there can be no assurance that FFO and Core FFO presented by us is comparable to similarly titled measures of other REITs.
NOI: Net Operating Income: Management believes that NOI is a useful measure of our property operating performance. We define NOI as operating revenues (rental and other revenues) less property and related expenses (property operation and maintenance and real estate taxes). Other REITs may use different methodologies for calculating NOI and, accordingly, our NOI may not be comparable to other REITs. Because NOI excludes general and administrative expenses, depreciation and amortization, equity or deficit in earnings of real estate partnership, interest expense, interest, dividend and other investment income, provision for income taxes, gain on sale of property from discontinued operations, management fee (net of related expenses) and gain or loss on sale or disposition of assets, and includes NOI of real estate partnership (pro rata) and net income attributable to noncontrolling interest, it provides a performance measure that, when compared year-over-year, reflects the revenues and expenses directly associated with owning and operating commercial real estate properties and the impact to operations from trends in occupancy rates, rental rates and operating costs, providing perspective not immediately apparent from net income. We use NOI to evaluate our operating performance since NOI allows us to evaluate the impact that factors such as occupancy levels, lease structure, lease rates and tenant base have on our results, margins and returns. In addition, management believes that NOI provides useful information to the investment community about our property and operating performance when compared to other REITs since NOI is generally recognized as a standard measure of property performance in the real estate industry. However, NOI should not be viewed as a measure of our overall financial performance since it does not reflect the level of capital expenditure and leasing costs necessary to maintain the operating performance of our properties, including general and administrative expenses, depreciation and amortization, equity or deficit in earnings of real estate partnership, interest expense, interest, dividend and other investment income, provision for income taxes, gain on sale of property from discontinued operations, management fee (net of related expenses) and gain or loss on sale or disposition of assets.
Same Store NOI: Management believes that Same Store NOI is a useful measure of the Company’s property operating performance because it includes only the properties that have been owned for the entire period being compared, and it is frequently used by the investment community. Same Store NOI assists in eliminating differences in NOI due to the acquisition or disposition of properties during the period being presented, providing a more consistent measure of the Company’s performance. The Company defines Same Store NOI as operating revenues (rental and other revenues, excluding straight-line rent adjustments, amortization of above/below market rents, and lease termination fees) less property and related expenses (property operation and maintenance and real estate taxes), Non-Same Store NOI, and NOI of our investment in Pillarstone OP (pro rata). We define “Non-Same Stores” as properties that have been acquired since the beginning of the period being compared and properties that have been sold, but not classified as discontinued operations. Other REITs may use different methodologies for calculating Same Store NOI, and accordingly, the Company's Same Store NOI may not be comparable to that of other REITs.
Net debt: We present net debt, which we define as total debt net of insurance financing less cash plus our proportional share of net debt of real estate partnership, and net debt to pro forma EBITDAre, which we define as net debt divided by EBITDAre because we believe they are helpful as supplemental measures in assessing our ability to service our financing obligations and in evaluating balance sheet leverage against that of other REITs. However, net debt and net debt to pro forma EBITDAre should not be viewed as a stand-alone measure of our overall liquidity and leverage. In addition, other REITs may use different methodologies for calculating net debt and net debt to pro forma EBITDAre, and accordingly our net debt and net debt to pro forma EBITDAre may not be comparable to that of other REITs.
| RECONCILIATION OF NON-GAAP MEASURES | |||||||
| Initial Full Year Guidance for 2024 | |||||||
| (in thousands, except per share and per unit data) | |||||||
| Projected Range Full Year 2024 | |||||||
| Low | High | ||||||
| FFO (NAREIT) and Core FFO per diluted share and OP unit | |||||||
| Net income attributable to | $ | 16,600 | $ | 19,600 | |||
| Adjustements to reconcile to FFO (NAREIT) | |||||||
| Depreciation and amortization of real estate assets | 34,252 | 34,252 | |||||
| Depreciation and amortization of real estate assets of real estate partnership (pro rata) | 133 | 133 | |||||
| FFO (NAREIT) | $ | 50,985 | $ | 53,985 | |||
| Adjustements to reconcile to Core FFO | |||||||
| Adjustments | — | — | |||||
| Core FFO | $ | 50,985 | $ | 53,985 | |||
| Dilutive shares | 51,262 | 51,262 | |||||
| OP Units | 695 | 695 | |||||
| Dilutive share and OP Units | 51,957 | 51,957 | |||||
| Net income attributable to | $ | 0.32 | $ | 0.38 | |||
| FFO (NAREIT) per diluted share and OP Unit | $ | 0.98 | $ | 1.04 | |||
| Net income attributable to | $ | 0.32 | $ | 0.38 | |||
| Core FFO per diluted share and OP Unit | $ | 0.98 | $ | 1.04 | |||
| RECONCILIATION OF NON-GAAP MEASURES | ||||||||
| (in thousands, except per share and unit data) | ||||||||
| Year Ended | ||||||||
| 2023 | 2021 | |||||||
| FFO (NAREIT) AND CORE FFO | ||||||||
| Net income attributable to | $ | 19,180 | $ | 12,048 | ||||
| Adjustments to reconcile to FFO:(1) | ||||||||
| Depreciation and amortization of real estate assets | 32,811 | 28,806 | ||||||
| Depreciation and amortization of real estate assets of real estate partnership (pro rata) (2) | 1,613 | 1,674 | ||||||
| Loss on disposal of assets, net | 522 | 90 | ||||||
| Gain on sale of properties from continuing operations, net | (9,006 | ) | (266 | ) | ||||
| Gain on sale of property from discontinued operations | — | (1,833 | ) | |||||
| Gain on sale or disposal of properties or assets of real estate partnership (pro rata)(2) | — | (19 | ) | |||||
| Net income attributable to noncontrolling interests | 270 | 205 | ||||||
| FFO (NAREIT) | $ | 45,390 | $ | 40,705 | ||||
| Adjustments to reconcile to Core FFO: | ||||||||
| Early debt extinguishment costs | — | — | ||||||
| Default interest on debt of real estate partnership (1)(2) | 1,375 | — | ||||||
| Core FFO | $ | 46,765 | $ | 40,705 | ||||
| FFO PER SHARE AND OP UNIT CALCULATION | ||||||||
| Numerator: | ||||||||
| FFO | $ | 45,390 | $ | 40,705 | ||||
| Core FFO | $ | 46,765 | $ | 40,705 | ||||
| Denominator: | ||||||||
| Weighted average number of total common shares - basic | 49,501 | 45,486 | ||||||
| Weighted average number of total noncontrolling OP units - basic | 694 | 772 | ||||||
| Weighted average number of total common shares and noncontrolling OP units - basic | 50,195 | 46,258 | ||||||
| Effect of dilutive securities: | ||||||||
| Unvested restricted shares | 1,312 | 850 | ||||||
| Weighted average number of total common shares and noncontrolling OP units - diluted | 51,507 | 47,108 | ||||||
| FFO per common share and OP unit - basic | $ | 0.90 | $ | 0.88 | ||||
| FFO per common share and OP unit - diluted | $ | 0.88 | $ | 0.86 | ||||
| Core FFO per common share and OP unit - basic | $ | 0.93 | $ | 0.88 | ||||
| Core FFO per common share and OP unit - diluted | $ | 0.91 | $ | 0.86 | ||||
| RECONCILIATION OF NON-GAAP MEASURES | |||||||
| (continued) | |||||||
| (in thousands) | |||||||
| Year Ended | |||||||
| 2023 | 2020 | ||||||
| EARNINGS BEFORE INTEREST, TAX, DEPRECIATION AND AMORTIZATION FOR REAL ESTATE (EBITDAre) | |||||||
| Net income attributable to | $ | 19,180 | $ | 6,034 | |||
| Depreciation and amortization | 32,966 | 28,303 | |||||
| Interest expense | 32,866 | 25,770 | |||||
| Provision for income taxes | 450 | 379 | |||||
| Net income attributable to noncontrolling interests | 270 | 117 | |||||
| (Equity) deficit in earnings of real estate partnership (1) | 3,155 | (921 | ) | ||||
| EBITDAre adjustments for real estate partnership (1) | 617 | 3,484 | |||||
| Loss (gain) loss on sale or disposal of assets, net | (8,484 | ) | 364 | ||||
| Gain on loan forgiveness | — | (1,734 | ) | ||||
| EBITDAre | 81,020 | 61,796 | |||||
| Year Ended | |||||||
| Debt/EBITDAre Ratio | 2023 | 2020 | |||||
| Outstanding debt | $ | 640,549 | $ | 645,163 | |||
| Less: Cash | (4,572 | ) | (25,777 | ) | |||
| Deposit due to real estate partnership debt default | (13,633 | ) | - | ||||
| Add: Proportional share of net debt of unconsolidated real estate partnership (1) | 8,685 | 8,912 | |||||
| Total Net Debt | $ | 631,029 | $ | 628,298 | |||
| EBITDAre | $ | 81,020 | $ | 61,796 | |||
| Ratio of debt to pro forma EBITDAre | 7.8 | 10.2 | |||||
| (1) We rely on reporting provided to us by our third-party partners for financial information regarding the Company's investment in Pillarstone OP. Because Pillarstone OP financial statements as of | |||||||
Investor and Media Contact:
Director, Investor Relations
(713) 435-2219
ir@whitestonereit.com
Photos accompanying this announcement are available at:
https://www.globenewswire.com/NewsRoom/AttachmentNg/86062beb-19a1-45f7-9823-2154b86b87af
https://www.globenewswire.com/NewsRoom/AttachmentNg/cf8120c5-b987-4481-9f4f-a19af1510b03

![]()
Strategic Missteps At Cedar
Cedar’s Stock Price Drops 56% Following Bruce Schanzer’s Strategic Missteps
Cedar / RPT Underperformance

Both Cedar and RPT Underperformed While Mr. Schanzer / Ms. Clark Were At The Respective Companies
2024 GlobeNewswire, Inc., source
