Highlights of the 2023 MRE include:
- Total Indicated Mineral Resources of 11.21 Moz AuEq (508.3 Mt at 0.69 g/t AuEq), representing an increase of 126% in ounces and a 187% increase in tonnes compared to the 2020 MRE.
- Additional Inferred Mineral Resources of 1.80 Moz AuEq (80.5 Mt at 0.69 g/t AuEq)
- Over 99% of the mineral resources in the Indicated category are classified as amenable to “Open Pit” from zones Z87, J, X22, and Southwest, which will form the basis of the Feasibility Study anticipated for completion in early 2024.
- Significant definition at the
Southwest Zone and the new discovery of Zone X22 were major new contributors to the open pit MRE, accounting for approximately 28% of the AuEq ounces in the Indicated category. The breakdown by zone is as follows:- Z87: 5.04Moz (197.1Mt at 0.80g/t AuEq), accounting for approximately 45% of open pit Indicated mineral resources.
J Zone : 2.98 Moz AuEq (151.9Mt at 0.61g/t AuEq), contributing 27% to the open pit Indicated mineral resources.Southwest Zone : 1.89Moz AuEq (98.0Mt at 0.60 g/t AuEq), accounting for nearly 17% of the open pit mineral resources in the Indicated category. A significant increase compared to the 583,000 oz AuEq (22.6 Mt at 0.80 g/t AuEq) Inferred ounces in the 2020 MRE.- Zone X22: Discovered in late 2022, and with only 23,256 metres drilled, this zone contributed 1.19Moz AuEq (59.2Mt at 0.62 g/t AuEq) or 11% of total open pit Indicated mineral resources.
Figure 1. Mineral Resource Growth in the Indicated Category from 2016-2023
(see Table 1 for complete results, incl. grade/tonnes)
https://www.globenewswire.com/NewsRoom/AttachmentNg/d74c4348-16d4-465f-b22b-580dd49c6331
Figure 2. Troilus Project Location Map and Mineral Deposits Locations
https://www.globenewswire.com/NewsRoom/AttachmentNg/ccf71f5d-c20f-4ca3-957b-565aaaf19d52
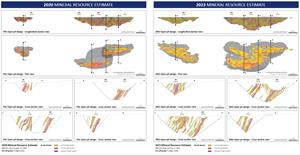
Figure 3. 2023 MRE Wireframes and Pitshells + Resource Distribution by Zone
https://www.globenewswire.com/NewsRoom/AttachmentNg/b9a52c9b-7254-4f05-bb8a-e5f9a311cec9
Troilus Project Mineral Resource Estimate
This MRE reflects the results of 505 drill holes (216,502 metres of drilling) completed since the mineral resource estimate announced in
The updated MRE for the
Table 1. Total Indicated and Inferred Mineral Resources, All Zones
| Category | Tonnes (Mt) | Au (g/t) | Cu (%) | Ag (g/t) | AuEq (g/t) | Gold (Moz) | Copper (Mlb) | Silver (Moz) | AuEq (Moz) |
| Indicated | 508.3 | 0.57 | 0.07 | 1.09 | 0.69 | 9.32 | 729.50 | 17.79 | 11.21 |
| Inferred | 80.5 | 0.58 | 0.07 | 1.47 | 0.69 | 1.49 | 115.41 | 3.81 | 1.80 |
Z87
The largest of the two formerly mined pits, zone Z87 contributed 5.04Moz AuEq (197.1Mt at 0.80g/t AuEq), or approximately 45% of the open pit Indicated mineral resources.
Discovered in late 2019, the
Zone X22
Zone X22 is a NE-SW deformation corridor that originates in the western wall of Zone 87 and extends to the southwest into the
The combination of infill drilling at an increased drill density, and the discovery and expansion of two new mineralized zones, has resulted in a 126% increase in Indicated mineral resources compared to the 2020 MRE, and a conversion from Inferred (2020 MRE) to Indicated (2023 MRE) of nearly 100%. The mineral resource estimates for Z87,
Figure 4. Open Pit Growth by Zone in the Indicated Category, 2016-2023
https://www.globenewswire.com/NewsRoom/AttachmentNg/db2a87a0-80e8-4280-b38f-41a090ea5a89
Table 2 – Total Indicated Mineral Resources, by Zone
| Zones | Tonnes (Mt) | Au (g/t) | Cu (%) | Ag (g/t) | AuEq (g/t) | Gold (Moz) | Copper (Mlb) | Silver (Moz) | AuEq (Moz) |
| OPEN PIT | |||||||||
| TOTAL OP | 506.2 | 0.57 | 0.07 | 1.09 | 0.68 | 9.23 | 725.66 | 17.67 | 11.11 |
| Z87 | 197.1 | 0.67 | 0.07 | 1.21 | 0.80 | 4.21 | 320.69 | 7.67 | 5.04 |
| 151.9 | 0.50 | 0.06 | 0.96 | 0.61 | 2.45 | 215.71 | 4.71 | 2.98 | |
| X22 | 59.2 | 0.51 | 0.06 | 1.24 | 0.62 | 0.98 | 79.34 | 2.35 | 1.19 |
| Southwest | 98.0 | 0.50 | 0.05 | 0.94 | 0.60 | 1.59 | 109.91 | 2.94 | 1.89 |
| UNDERGROUND | |||||||||
| TOTAL UG | 2.1 | 1.35 | 0.09 | 1.90 | 1.51 | 0.09 | 3.84 | 0.13 | 0.10 |
| Z87 | 0.5 | 1.59 | 0.15 | 0.54 | 1.83 | 0.02 | 1.55 | 0.01 | 0.03 |
| 0.2 | 1.21 | 0.07 | 1.46 | 1.33 | 0.01 | 0.29 | 0.01 | 0.01 | |
| Southwest | 1.4 | 1.28 | 0.07 | 2.44 | 1.42 | 0.06 | 2.00 | 0.11 | 0.06 |
| Total INDICATED (OP + UG) | |||||||||
| TOTAL | 508.3 | 0.57 | 0.07 | 1.09 | 0.69 | 9.32 | 729.50 | 17.79 | 11.21 |
Table 3. Total Inferred Mineral Resources, by Zone
| Zones | Tonnes (Mt) | Au (g/t) | Cu (%) | Ag (g/t) | AuEq (g/t) | Gold (Moz) | Copper (Mlb) | Silver (Moz) | AuEq (Moz) |
| OPEN PIT | |||||||||
| TOTAL OP | 76.5 | 0.53 | 0.06 | 1.12 | 0.65 | 1.31 | 108.66 | 2.75 | 1.59 |
| Z87 | 37.1 | 0.59 | 0.06 | 1.11 | 0.70 | 0.71 | 50.17 | 1.33 | 0.84 |
| 24.2 | 0.46 | 0.07 | 0.94 | 0.57 | 0.35 | 35.37 | 0.73 | 0.44 | |
| X22 | 13.6 | 0.53 | 0.07 | 1.48 | 0.67 | 0.23 | 21.76 | 0.65 | 0.29 |
| Southwest | 1.6 | 0.37 | 0.04 | 0.96 | 0.45 | 0.02 | 1.36 | 0.05 | 0.02 |
| Underground | |||||||||
| TOTAL UG | 4.0 | 1.36 | 0.08 | 8.21 | 1.58 | 0.18 | 6.75 | 1.06 | 0.20 |
| Z87 | 1.1 | 1.99 | 0.12 | 0.46 | 2.19 | 0.07 | 2.96 | 0.02 | 0.08 |
| 1.0 | 1.25 | 0.05 | 0.99 | 1.34 | 0.04 | 1.13 | 0.03 | 0.04 | |
| Southwest | 1.9 | 1.05 | 0.06 | 16.62 | 1.37 | 0.06 | 2.66 | 1.01 | 0.08 |
| Total INFERRED (OP + UG) | |||||||||
| TOTAL | 80.5 | 0.58 | 0.07 | 1.47 | 0.69 | 1.49 | 115.41 | 3.81 | 1.80 |
The MRE sensitivity table (see Table 4) shows the potential for higher-grade Mineral Resources at higher gold equivalent cut-offs.
Table 4. Open-Pit MRE Sensitivity Table
| Cut-off Grade (g/t AuEq) | Tonnes (Mt) | AuEq (g/t) | Au (g/t) | Cu (%) | Ag (g/t) | Gold (Moz) | Copper (Mlb) | Silver (Moz) | AuEq (Moz) |
| Indicated | |||||||||
| 0.50 | 264.9 | 0.95 | 0.80 | 0.08 | 1.33 | 6.85 | 477.86 | 11.30 | 8.08 |
| 0.45 | 311.8 | 0.88 | 0.74 | 0.08 | 1.27 | 7.41 | 532.64 | 12.701 | 8.79 |
| 0.40 | 364.0 | 0.81 | 0.68 | 0.07 | 1.21 | 8.01 | 593.64 | 14.26 | 9.55 |
| 0.35 | 432.7 | 0.74 | 0.62 | 0.07 | 1.15 | 8.63 | 659.96 | 15.96 | 10.34 |
| 0.30 | 506.2 | 0.68 | 0.57 | 0.07 | 1.09 | 9.23 | 725.66 | 17.67 | 11.11 |
| 0.25 | 584.5 | 0.63 | 0.52 | 0.06 | 1.03 | 9.76 | 784.98 | 19.28 | 11.80 |
| Inferred | |||||||||
| 0.50 | 37.8 | 0.91 | 0.77 | 0.08 | 1.38 | 0.94 | 67.03 | 1.68 | 1.11 |
| 0.45 | 45.2 | 0.84 | 0.71 | 0.08 | 1.31 | 1.03 | 75.76 | 1.91 | 1.22 |
| 0.40 | 54.0 | 0.77 | 0.65 | 0.07 | 1.25 | 1.12 | 85.85 | 2.167 | 1.34 |
| 0.35 | 64.3 | 0.71 | 0.59 | 0.07 | 1.19 | 1.22 | 96.97 | 2.45 | 1.47 |
| 0.30 | 76.5 | 0.65 | 0.53 | 0.06 | 1.12 | 1.31 | 108.66 | 2.75 | 1.59 |
| 0.25 | 90.9 | 0.59 | 0.48 | 0.06 | 1.05 | 1.41 | 120.41 | 3.06 | 1.72 |
Figure 5 depicts a linear relationship between ore tonnes and grade at variable cutoff grades, outlining a robust resource that has low sensitivity to changing cut-off grades caused by changing market or economic conditions.
Figure 5. Grade and Tonnage vs. Cut-off (Indicated Mineral Resources)
https://www.globenewswire.com/NewsRoom/AttachmentNg/0aad28aa-d820-4a2a-aef5-1ca4f7f20c68
Figure 6. 2023 Mineral Resource Estimate Pit Constrained Block model
https://www.globenewswire.com/NewsRoom/AttachmentNg/583e3af5-9d91-437b-8816-3c9f762e5e29
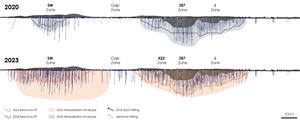
Figure 7. 2020 vs. 2023 Mineral Resource Estimate Cross Sections
https://www.globenewswire.com/NewsRoom/AttachmentNg/c35370aa-f929-4439-b24c-fa4add5db52b
Notes Related to the Mineral Resource Estimate
- The independent and qualified person for the mineral resource estimate, as defined by NI 43 101, is
Paul Daigle , géo., Senior Resource Geologist at AGP. The effective date of the estimate isOctober 2, 2023 . - Mineral Resources that are not Mineral Reserves do not have demonstrated economic viability.
- Summation errors may occur due to rounding.
- Open pit mineral resources are reported within an optimized constraining shells.
- Open pit cut-off grade is 0.3 g/t AuEq where the metal equivalents were calculated as follows:
- Z87 Zone : AuEq = Au grade + 1.5628 * Cu grade + 0.0128 * Ag grade
- J Zone : AuEq = Au grade + 1.5107 * Cu grade + 0.0119 * Ag grade
- X22 Zone : AuEq = Au grade + 1.5628 * Cu grade + 0.0128* Ag grade
- SW Zone : AuEq = Au grade + 1.6823 * Cu grade + 0.0124 * Ag grade
- Metal prices for the AuEQ formulas are:
$US 1,850 / oz Au;$4.25 /lb Cu, and$23.00 / oz Ag; with an exchange rate ofUS$1 .00:CAD$1.30 - Metal recoveries for the AuEq formulas are:
Z87 Zone : 95.5% for Au recovery, 94.7% for Cu recovery and 98.2% for Ag recoveryJ Zone : 93.1% for Au recovery, 89.3% for Cu recovery and 88.9% for Ag recoveryX22 Zone : 95.5% for Au recovery, 94.7% for Cu recovery and 98.2% for Ag recoverySW Zone : 85.7% for Au recovery, 91.5% for Cu recovery and 85.6% for Ag recovery
- The resource constraining shells were generated with:
- Metal Prices: Gold
$US 1,850 /oz, Copper$US 4.25 /lb, Silver$US 23 /oz - Mining Costs:
J Zone :- waste – base
$Cdn 2.15 /t moved (incremental below5360 $Cdn 0.039/t moved) - ore – base
$Cdn 2.29 /t moved (incremental below5360 $Cdn 0.036/t moved)
- waste – base
- 87 Zone
- Waste – base
$Cdn 1.99 /t moved (incremental below5360 $Cdn 0.041/t moved) - Ore – base
$Cdn 2.10 /t moved (incremental below5360 $Cdn 0.029/t moved)
- Waste – base
SW Zone - Waste – base
$Cdn 2.01 /t moved (incremental below5360 $Cdn 0.036/t moved) - Ore – base
$Cdn 2.37 /t moved (incremental below5360 $Cdn 0.028/t moved)
- Waste – base
X22 Zone - Waste – base
$Cdn 2.15 /t moved (incremental below5360 $Cdn 0.039/t moved) - Ore – base
$Cdn 2.29 /t moved (incremental below5360 $Cdn 0.036/t moved)
- Waste – base
- Metal Prices: Gold
- Process and G&A Costs:
$Cdn 9.05 /t - Wall slopes: varied between 39 and 49 degrees depending on pit area and slope sector.
- Overall Metal Recoveries:
J Zone - 91% Au, 88% Ag, 89% Cu- 87 Zone - 94% Au, 98% Ag, 94% Cu
SW Zone - 82% Au, 86% Ag, 91% CuX22 Zone - 93% Au, 98% Ag, 93% Cu
(X22 recoveries are estimates based onJ Zone . Metallurgical test work is underway for X22)
- Capping of grades varied between 2.30 g/t Au and 14.60 g/t Au; between 0.07% cu and 4.36 %Cu, and between 4.90 g/t Ag and 55.00 g/t Ag; on raw assays.
- The density (excluding overburden and fill) varies between 2.64 g/cm3 and 2.93 g/cm3 depending on lithology for each zone.
- Underground cut-off grade is 0.9 g/t AuEq for Z87, J and SW
The complete technical report associated with the updated mineral resource estimate (the “Technical Report”) will be available on SEDAR+ at www.sedarplus.ca under the Company’s issuer profile, as well as the Company’s website at www.troilusgold.com within 45 calendar days.
Qualified Persons
The technical and scientific information in this press release has been reviewed and approved by
The updated mineral resource estimate disclosed in this press release was prepared by Mr.
About
For more information:
Chief Executive Officer,
+1 (647) 276-0050 x 1305
justin.reid@troilusgold.com
VP Corporate Communications
+1 (647) 407-7123
info@troilusgold.com
Cautionary statements
This press release contains “forward‑looking information” within the meaning of applicable Canadian securities legislation. Forward‑looking information includes, but is not limited to, statements about the mineral resource estimate for the Project; the timing of completion and filing of a National Instrument 43-101 technical report related to Project and the impact of the report on the Company; and statements with respect the timing and other aspects of the Feasibility Study. Generally, forward-looking statements can be identified by the use of forward-looking terminology such as “plans”, “expects” or “does not expect”, “is expected”, “budget”, “scheduled”, “estimates”, “forecasts”, “intends”, “continue”, “anticipates” or “does not anticipate”, or “believes”, or variations of such words and phrases or statements that certain actions, events or results “may”, “could”, “would”, “will”, “might” or “will be taken”, “occur” or “be achieved”. Forward-looking statements are made based upon certain assumptions and other important facts that, if untrue, could cause the actual results, performances or achievements of Troilus to be materially different from future results, performances or achievements expressed or implied by such statements. Such statements and information are based on numerous assumptions regarding present and future business strategies and the environment in which Troilus will operate in the future. Certain important factors that could cause actual results, performances or achievements to differ materially from those in the forward-looking statements include, amongst others, currency fluctuations, the global economic climate, dilution, share price volatility and competition. Forward-looking statements are subject to known and unknown risks, uncertainties and other important factors that may cause the actual results, level of activity, performance or achievements of Troilus to be materially different from those expressed or implied by such forward-looking statements, including but not limited to: the impact the COVID 19 pandemic may have on the Company’s activities (including without limitation on its employees and suppliers) and the economy in general; the impact of the recovery post COVID 19 pandemic and its impact on gold and other metals; there being no assurance that the exploration program or programs of the Company will result in expanded mineral resources; risks and uncertainties inherent to mineral resource estimates; the high degree of uncertainties inherent to feasibility studies and other mining and economic studies which are based to a significant extent on various assumptions; variations in gold prices and other precious metals, exchange rate fluctuations; variations in cost of supplies and labour; receipt of necessary approvals; general business, economic, competitive, political and social uncertainties; future gold and other metal prices; accidents, labour disputes and shortages; environmental and other risks of the mining industry, including without limitation, risks and uncertainties discussed in the Technical Report, the Company’s latest annual information form and in other continuous disclosure documents of the Company available under the Company’s profile at www.sedarplus.ca. Although Troilus has attempted to identify important factors that could cause actual results to differ materially from those contained in forward-looking statements, there may be other factors that cause results not to be as anticipated, estimated or intended. There can be no assurance that such statements will prove to be accurate, as actual results and future events could differ materially from those anticipated in such statements. Accordingly, readers should not place undue reliance on forward-looking statements. Troilus does not undertake to update any forward-looking statements, except in accordance with applicable securities laws.


Figure 1

Mineral Resource Growth in the Indicated Category from 2016-2023 (see Table 1 for complete results, incl. grade/tonnes)
Figure 2
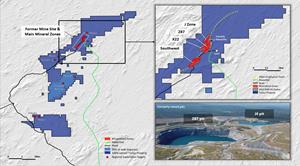
Troilus Project Location Map and Mineral Deposits Locations
Figure 3

2023 MRE Wireframes and Pitshells + Resource Distribution by Zone
Figure 4

Open Pit Growth by Zone in the Indicated Category, 2016-2023
Figure 5

Grade and Tonnage vs. Cut-off (Indicated Mineral Resources)
Figure 6
2023 Mineral Resource Estimate Pit Constrained Block model
Figure 7
2020 vs. 2023 Mineral Resource Estimate Cross Sections
2023 GlobeNewswire, Inc., source


