Monique Deposit Updated NI 43-101 Resource Estimate ("Resource Estimate") Highlights:
- In the first of three updated resource estimates (Monique, Pascalis and Courvan) to be released in Spring, drilling at Monique deposit has already achieved an overall substantial gain especially illustrated by over 1.3 million additional ounces in Indicated (upgrade from previous Inferred and significant new Indicated added) and is now comprised of 2,038,900 ounces in the Indicated category and 357,200 ounces in the Inferred category, up from 672,800 (Indicated) and 671,400 (Inferred) in the previous (2021) NI 43-101 resource estimate.
- Total Resources currently stand at 2,038,900 ounces Indicated and 357,200 ounces Inferred for Monique and 1,128,100 ounces Indicated (historical) and 1,638,200 Inferred ounces (historical) for Pascalis and Courvan deposits (neither the QPs nor the Company considers this historical estimate as current mineral resources (see Table 5 Notes)). Pascalis and Courvan are in the process of being updated and will be released in the coming months.
- Indicated mineral resources for Monique more than tripled to 2,038,900 ounces, mostly within the current mining lease and pit-constrained resource.
- Potential significant mine plan improvement with Monique gold resources now connecting multiple mining areas into a single open pit.
- Average gold grade in the Monique pit-constrained Indicated resource increases to 1.42 g/t gold, from 1.38 g/t gold at the same cut-off grade of 0.42 g/t gold.
- The Monique deposit is still open in all directions and four drills are currently turning on the 2023 expansion program as part of a planned 50,000-metre drill program for the
Novador Project .
Monique Deposit,
The Monique property is part of the
Table 1: Monique Deposit 2023 Mineral Resource Estimate
| Category | Pit-Constrained Resources | Underground Resources | Total | ||||||
| Tonnes | Grade (Au g/t) | Gold (oz) | Tonnes | Grade (Au g/t) | Gold (oz) | Tonnes | Grade (Au g/t) | Gold (oz) | |
| Indicated | 36,914,400 | 1.42 | 1,685,300 | 4,929,300 | 2.23 | 353,600 | 41,843,700 | 1.52 | 2,038,900 |
| Inferred | 4,349,700 | 1.36 | 190,200 | 2,383,500 | 2.18 | 167,000 | 6,733,200 | 1.65 | 357,200 |
Notes:
- The independent and qualified persons (QPs) for the mineral resource estimate, as defined by NI 43-101, are
Marina Iund ,P.Geo . andSimon Boudreau ,P.Eng ., both fromInnovExplo Inc. The effective date isJanuary 16, 2023 . - These mineral resources are not mineral reserves, as they do not have demonstrated economic viability. The mineral resource estimate follows current CIM definitions and guidelines.
- The results are presented undiluted and are considered to have reasonable prospects for eventual economic viability.
- The estimate encompasses the Monique gold deposit subdivided into 38 individual zones and one inter-zone envelop using the grade of the adjacent material when assayed or a value of zero when not assayed. The geological interpretation of the deposit was based on lithologies, alteration and mineralization and the spatial relation between mineralized zones occurring either within or proximal to sub-vertical dykes and trending sub-parallel to lithological contacts and deformation zones.
- High-grade capping supported by statistical analysis was done on raw assay data before compositing: 100 g/t Au.
- The estimate was completed using block models in GEOVIA Surpac 2021 with parent block size of 6 x 6 x 6m and sub-block of 1.5 x 1.5 x 1.5m.
- Grade interpolation was performed with the ID2 method on 1m composites.
- Density values of 2.88 g/cm3 (mineralized and unmineralized material) and 2.00 g/cm3 (overburden) were assigned.
- The mineral resource estimate is classified as Indicated and Inferred. The Inferred category is defined with a minimum of two (2) drill holes for areas where the drill spacing is less than 80 m, and reasonable geological and grade continuity have been shown. The Indicated category is defined with a minimum of three (3) drill holes within the areas where the drill spacing is less than 55 m, and reasonable geological and grade continuity have been shown. Clipping boundaries were used for classification based on those criteria.
- The estimate considered both open pit and underground scenarios. Bedrock slope angle of 48° to 59° and overburden slope angle of 30° were used for the pit-constrained scenario using Whittle. The out-pit mineral resource was constrained within potential stope volumes (potential underground long-hole extraction scenario) using Deswik Stope Optimizer.
- The pit-constrained mineral resource estimate is reported at a cut-off grade of 0.42 g/t Au, a value above the base case cut-off grade. A base case cut-off grade of 0.26 g/t Au was calculated using the following parameters: mining cost = CA$2.97; mining overburden cost = CA$2.70; processing cost = CA$17.82; selling costs = CA$ 5.00; royalty = CA$ 8.59/oz; gold price =
US$ 1,700 /oz; USD:CAD exchange rate = 1.33; and mill recovery = 95%. The use of a higher cut-off at 0.42 g/t Au could allow the selection of in-pit mineralized waste (0.20 – 0.42 g/t Au) for its potential upgrade through an industrial sorter process. - The underground mineral resource estimate is reported at a cut-off grade of 1.43 g/t Au. The cut-off grade was calculated using the following parameters: mining cost = CA$81.00; processing cost = CA$17.82; selling costs = CA$ 5.00; royalty = CA$ 8.59/oz; gold price =
US$ 1,700 /oz; USD:CAD exchange rate = 1.33; and mill recovery = 95%. - The cut-off grades should be re-evaluated in light of future prevailing market conditions (metal prices, exchange rates, mining costs etc.).
- The number of metric tonnes was rounded to the nearest thousand, following the recommendations in NI 43-101 and any discrepancies in the totals are due to rounding effects. The metal contents are presented in troy ounces (tonnes x grade / 31.10348).
- The QPs are not aware of any known environmental, permitting, legal, title-related, taxation, socio-political, or marketing issues, or any other relevant issue not reported in the Technical Report, that could materially affect the Mineral Resource Estimate.
The Company has demonstrated with a series of performance tests that the industrial sorting technology works very well with the type of mineralization found on the Novador project. By applying industrial sorting to mineralized waste with very conservative gold recoveries, additional mineral material can be extracted from the mineralized waste and thus become additional mineral resource on the Project.
Table 2: Monique Deposit Additional Pit Constrained Resource from Industrial Sorting
| Resources Category | Tonnes | Grade (Au g/t) | Ounces (oz) |
| Indicated | 16,427,578 | 0.32 | 166,900 |
| Inferred | 6,305,600 | 0.28 | 56,500 |
Notes:
- This additional pit-constrained Mineral Resource represents mineralized waste between cut-off grades of 0.20 g/t Au and 0.42 g/t Au exclusive of pit-constrained Mineral Resource from Table 1. This lower cut-off was based on the following parameters: industrial sorting cost CA$1.73/t, gold recovery in the industrial sorting process 82% with an overall gold recovery with gravity and leaching at 68%, mass recovery in the industrial sorting process 42%. Potentially, the industrial sorting results on this material allow obtaining a product above 0.42 g/t Au. For more details on industrial sorting technique and parameters, see the "Val-d’Or East Project, NI 43-101 Technical Report & Preliminary Economic Analysis” (the "Val-d’Or East PEA"), dated
October 20, 2021 , and available on SEDAR (www.sedar.com) under Company's issuer profile.
Additions to the Current Resource Estimate Relative to the 2021 Resource Estimate at Monique
The 2021 mineral resource estimate hosted a NI 43-101 resource of 672,800 ounces of gold Indicated and 671,400 ounces of gold Inferred. A total of 128,978 metres (453 drill holes) has been drilled since this Resource Estimate. Using a gold price of
A photo accompanying this announcement is available at https://www.globenewswire.com/NewsRoom/AttachmentNg/424caa18-ee47-4481-acd2-ee7c804b0005
A photo accompanying this announcement is available at https://www.globenewswire.com/NewsRoom/AttachmentNg/a0af17df-9f49-4557-9864-a9f1ae1c3619
The following Tables 3 and 4 are not official estimates and are presented for illustrative purposes only. The reader should be cautioned that the following figures provided in those tables should not be interpreted as a mineral resource statement. The reported quantities and grade estimates at different cut-off grades are presented for the sole purpose of demonstrating the variability of the block model inside the selected
Table 3 presents different block selections at different cut-offs contained within the official resource pit shell (optimized at
Table 3: Monique Deposit Pit Constrained Mineralized Material for Variable Cut-Off Grades within Fixed Resource
| Resources Category | Cut-Off Grade | Tonnes | Grade (Au g/t) | Ounces (oz.) |
| Block Selections at Different Cut-Off within | ||||
| Indicated | 0.20 | 53,341,999 | 1.08 | 1,852,153 |
| 0.30 | 45,060,170 | 1.23 | 1,781,893 | |
| 0.39 | 38,756,342 | 1.37 | 1,707,053 | |
| 0.42 | 36,914,422 | 1.42 | 1,685,265 | |
| 0.45 | 35,143,370 | 1.47 | 1,660,904 | |
| Inferred | 0.20 | 10,655,258 | 0.72 | 247,506 |
| 0.30 | 6,613,332 | 1.02 | 215,873 | |
| 0.39 | 4,766,746 | 1.28 | 196,162 | |
| 0.42 | 4,349,661 | 1.36 | 190,186 | |
| 0.45 | 4,039,360 | 1.43 | 185,709 | |
Table 4 presents different block selections at different cut-offs contained within the official resource underground constraining volumes (optimized at
Table 4: Monique Deposit Underground Constrained Mineralized Material for Variable Cut-Off Grades at
| Resources Category | Cut-Off Grade | Tonnes | Grade (Au g/t) | Ounces (oz.) |
| Block Selections at Different Cut-Off within Underground Constraining Volumes at | ||||
| Indicated | 1,43 | 4,929,287 | 2.23 | 353,592 |
| 1,65 | 3,539,954 | 2.50 | 284,263 | |
| 2,00 | 2,237,733 | 2.90 | 208,810 | |
| Inferred | 1,43 | 2,383,494 | 2.18 | 166,977 |
| 1,65 | 1,856,897 | 2.35 | 140,558 | |
| 2,00 | 1,053,445 | 2.76 | 93,533 | |
Resource Estimation Methodology and Parameters
As part of the resource estimation process, the Company and InnovExplo compiled, verified, and modelled all technical information available from the Project, including 960 drill hole collars consisting of 124,181 gold assays, which represented 239,553 metres of drilling. 3D geological models were built for sub-vertical structures and included key structures hosting and constraining gold mineralization along the Monique Gold Trend. The drill holes database closing date is
In addition to the new Monique mineral resources (this Press Release), the
The result from historical mineral resources estimates on Courvan, Pascalis and other smaller deposits on the Project were published previously by the Company and are available in “NI 43-101 Technical Report for the Val-d’Or East Project, Abitibi Greenstone Belt,
Table 5: Novador Pascalis and Courvan deposits historical resource
| Deposit / Category | Historical Pit-Constrained Resources | Historical Underground Resources | Total | ||||||
| Tonnes | Gold Grade (Au g/t)14 | Gold (oz.) | Tonnes | Gold Grade (Au g/t)14 | Gold (oz.) | Tonnes | Gold Grade (Au g/t)14 | Gold (oz.) | |
| Pascalis Gold Deposits | |||||||||
| Measured | 4,491,000 | 2.20 | 317,300 | 640,000 | 2.40 | 49,400 | 5,131,000 | 2.22 | 366,700 |
| Indicated | 6,307,000 | 1.76 | 356,500 | 766,000 | 2.64 | 65,000 | 7,073,000 | 1.85 | 421,500 |
| Mes & Ind | 10,798,000 | 1.94 | 673,800 | 1,406,000 | 2.53 | 114,400 | 12,204,000 | 2.01 | 788,200 |
| Inferred | 6,007,000 | 1.63 | 315,500 | 2,694,000 | 2.77 | 239,900 | 8,701,000 | 1.99 | 555,500 |
| Courvan Gold Deposits | |||||||||
| Measured | 620,000 | 1.52 | 30,300 | 20,000 | 3.22 | 2,100 | 640,000 | 1.57 | 32,400 |
| Indicated | 2,710,000 | 1.93 | 168,200 | 604,000 | 3.50 | 68,000 | 3,314,000 | 2.22 | 236,200 |
| Mes & Ind | 3,330,000 | 1.85 | 198,500 | 624,000 | 3.49 | 70,100 | 3,954,000 | 2.11 | 268,600 |
| Inferred | 5,613,000 | 1.81 | 327,300 | 2,885,000 | 4.38 | 406,200 | 8,498,000 | 2.68 | 733,500 |
Notes:
- The mineral resource estimates mentioned above are “historical” and should not be relied upon. The Courvan and Pascalis 2021 historical estimate are included for illustrative purposes only. The QPs have not completed sufficient work to classify it as current. Neither the QPs nor the Company considers this historical estimate as current mineral resources or reserves.
- Historical mineral resources which are not mineral reserves do not have demonstrated economic viability. The estimate of mineral resources may be materially affected by environmental, permitting, legal, title, market, or other relevant issues.
- The database used for this historical mineral estimate includes drill results obtained from historical to the 2020 drill program.
- The pit-constrained historical mineral resources were reported at a cut-off grade of 0.40g/t for Courvan and Pascalis deposits. These cut-offs were calculated at a gold price of
US$1,600 with an exchange rate of1.333 US$ /C$ per troy ounce. They were based on the following parameters: mining cost 3.00 or 3.50$/t, processing + G&A costs$21.50 /t, transport cost to the central processing facility based on distance on existing roads @$0.15 /t.km, Au recovery 95%, pit slopes from 48° to 59° as per the press release ofFebruary 23 rd, 2021. - The underground historical mineral resources were based on two main mining methods, long-hole retreat at
$82 /t depending on width of stopes, and mechanized cut & fill at$110 /t and the same above ground unit cost as for the pit-constrained scenario, resulting in cut-off grades of 1.65 and 2.05 g/t Au. These cut-off grades were then used to delineate continuous underground mineral shapes above the calculated cut-off grades. Blocks within those UG mineral shapes that are below the cut-off were included as dilution material and the grade reported represents the average of all UG mineral shapes thus delineated. - The geological interpretation of the deposits was based on lithologies and the observation that mineralized domains occur either within or proximal to sub-vertical dykes, deformation zones or as low dipping quartz tourmaline vein sets.
- The historical mineral resource presented here were estimated with a block size of 2.5m X 2.5m X 2.5m for Courvan and Pascalis.
- The blocks were interpolated from equal length composites calculated from the mineralized intervals. Prior to compositing, high-grade gold assays were capped (capping maximum ranges from 28 to 100 g/t Au depending on the deposit). Depending on the deposit, the composites were 1.0 metre or 1.5 metres.
- The mineral estimation was completed using the inverse distance to the square methodology utilizing three passes. For each pass, search ellipsoids followed the geological interpretation trends were used.
- The historical mineral resources have been classified under the guidelines of the CIM Standards on Mineral Resources and Reserves, Definitions and Guidelines prepared by the
CIM Standing Committee on Reserve Definitions and adopted byCIM Council (2019), and procedures for classifying the reported Mineral Resources were undertaken within the context of the Canadian Securities Administrators NI 43-101. - To accurately estimate the historical resources, underground voids (shaft, ramp, and drifts) and the existing pits were subtracted from the mineralized bodies modeled prior to the pit optimization.
- Tonnage estimates are based on measured rock densities by Gold Trend. 2.82 tonnes per cubic metre for the Courvan Gold Trend and 2.83 for the Pascalis Gold Trend. Results are presented undiluted and in situ for the pit-constrained resources and diluted for the UG resources.
- This historical mineral resource estimate is dated
June 1, 2021 , and the cut-off date for the drillhole database used to produce this updated mineral resource estimate isMay 8, 2021 . Tonnages and ounces in the tables are rounded to nearest thousand and hundred respectively. Numbers may not total due to rounding. - Additional details are provided in the technical report.
- Au = Gold
The mineral resource estimates mentioned above are “historical” and should not be relied upon. The Courvan and Pascalis 2021 historical estimate are included for illustrative purposes only. The QPs have not completed sufficient work to classify it as current. Neither the QPs nor the Company considers this historical estimate as current mineral resources or reserves.
Next Steps
A technical report with respect to the latest mineral resource estimate disclosed today will be filed within 45 days in accordance with NI 43-101.
About
Since 2016, Probe Gold has been consolidating its land position in the highly prospective Val-d’Or East area in the province of
Monique Property Geology:
Gold mineralization on the Monique property is mainly associated with three deformation zones that cross the property with an orientation of 280° and a 75°- 80° dip to the north. Gold mineralization is defined by a network of quartz/carbonate/albite/±tourmaline veins and veinlets with disseminated pyrite in the altered wall rocks. More than thirty-eight (38) parallel gold zones have been discovered on the property, to-date. Some mineralized zones have been defined from surface to a depth of 700 metres and vary in width from 1 metre to up to 100 metres. Mineralized structures extend laterally up to 1,500 metres.
Independent Qualified Persons
The Monique Mineral Resource Estimate was prepared for
Marina Iund ,P.Geo .,M.Sc ., Senior Resources Geologist.Ms. Iund is a professional geologist in good standing with the OGQ (permit No. 1525), PGO (license No. 3123) and the NAPEG (licence No. L4431).Simon Boudreau ,P.Eng ., SeniorMine Engineer .Mr. Boudreau is a professional engineer in good standing with the OIQ (permit No. 1320338).
The technical content of this press release has been prepared, reviewed, and approved by Mr.
Quality Control
During the 2021 and 2022 drilling program, assay samples were taken from the NQ core and sawed in half, with one-half sent to
About Probe Gold:
Probe
On behalf of
Dr.
President & Chief Executive Officer
For further information:
Please visit our website at www.probemetals.com or contact:
Vice-President of Investor Relations
info@probemetals.com
+1.416.777.9467
Forward-Looking Statements
Neither

![]()
Figure 1 Novador gold deposits location map
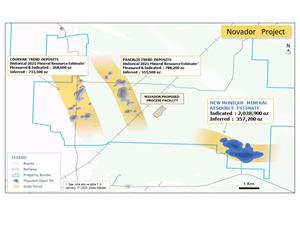
Novador gold deposits location map
Figure 2 Monique Deposit 3D views
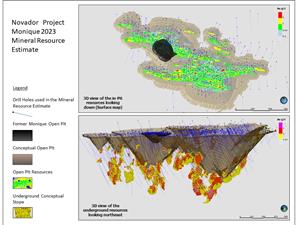
Monique Deposit 3D views
2023 GlobeNewswire, Inc., source


