 UK 10Y CASH
 In the world of fixed income investing, yield curve inversion has become a common term and is something to watch for when looking at economic conditions. A yield curve inversion occurs when longer-term interest rates of a security are lower than shorter-term interest rates of a comparable security, and is seen as an indication of an upcoming recession.
The two main types of yield curve inversions that investors look for are American and European yield curve inversions.
American Yield Curve
American yield curve inversion typically occurs when short-term yields on 2-year U.S. Treasury bonds exceed long-term yields on 10-year treasuries. This type of yield curve inversion can be indicative of an impending recession, and in fact has virtually a perfect score in predicting recessions since WWII.
As of the writing of this article (December 7th) the yield curve inversion in U.S. treasuries is currently the steepest it has been in at least 3 decades, with a spread of -0.84bps between the 2-year and 10-year Treasuries yields:

European Yield Curve
European yield curve inversion, on the other hand, is slightly more complex as the E.U. is made up of individual member states with their own economic challenges and conditions, but the German Bund yields and UK GILT Yields are often used as a proxy for the Eurozone economy.
German Bund yields have traditionally been more resistant to yield curve inversions, with short-term yields at one point being negative prior to 2020. However, in a historically rare occurrence, they are also currently inverted with a spread of -20bps:

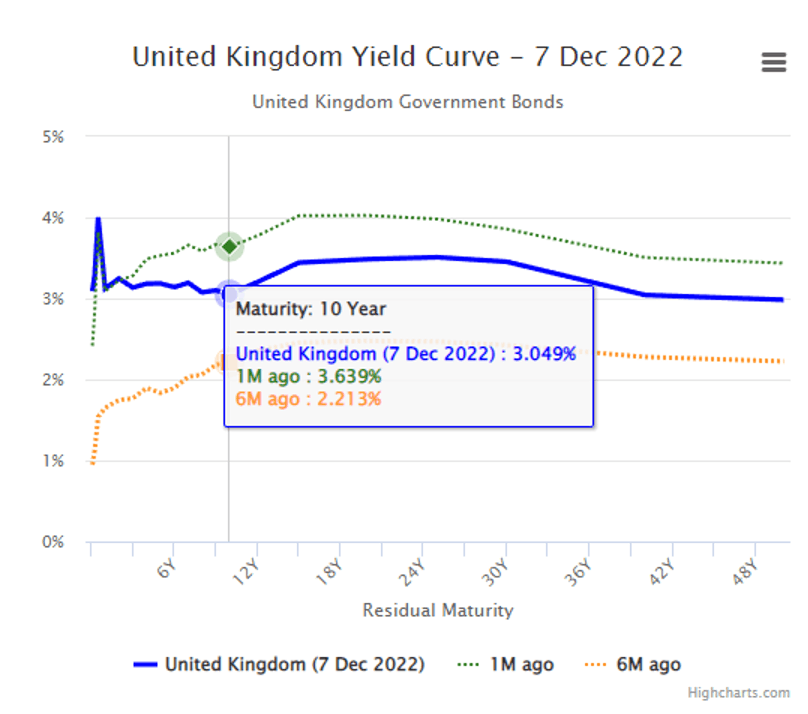
The UK GILT curve has also recently inverted, though the inversion is much less pronounced than observed in German Bunds or U.S. treasuries. The current spread between the 10-year and 2-year GILT yields is only 0.19 bps. Only one month ago however, the curve was still positively sloped as shown by the green dotted line below:
The impact of inversion on Fixed Income investors
For fixed income investors who follow global markets closely, understanding both American and European yield curves can be critical to successful investing decisions. Being able to identify when either type of yield curve inversion occurs can help investors make better decisions about when to invest and when to wait for more favorable conditions.
Yield curves may also be useful for evaluating market trends that could impact certain investments such as mortgage rates or stock prices.
For the purpose of fixed income investing, the historical success of yield curve inversions in predicting recessions is extremely important, as bond funds usually experience above average inflows during recessionary periods as investors flock to their relative safety.
ETF flow data from the month of October shows a clear trend in investor preferences, and their expectations for future performance in various sectors:

Investors began moving out of traditionally high yielding equity ETFs such as those focusing on Utilities, and towards fixed income related investments in the form of U.S. Treasuries and High Yield Debt. Looking closely at the heat map, we see U.S. Treasuries experienced inflows around the 3.8% mark, far above those in “defensive” equity sectors like Consumer Staples, and even Healthcare.
With the normal shape of the yield curve being upward sloping, and Central Banks’ goal to return to it by 2025, fixed income investors should focus their efforts on Bond ETFs with short to medium term average maturities which take advantage of yields on the short-end and medium range of the curve. As the long-term rates will begin to rise relative to the short-term, bonds with long maturities are more likely to drop in price, and exposure to them should be minimized.
Although short term yields (2 year Treasuries, GILTS or Bunds) will likely end higher than their pre-pandemic levels, due to the inflationary pressures caused by geopolitical tensions and a reversal of globalization, most analysts and economists expect them to fall from their current levels.
Investors are able to lock in the relatively high yields available on 3-month, 1 year and 2-year U.S. Treasuries, as well as those provided by Investment Grade Corporate Bond ETFs.
Using the Trackinsight ETF screener, investors can learn more about some of the available ETFs that exhibit the qualities mentioned above:
- iShares $ Treasury Bond 1-3yr UCITS ETF
- iShares $ Floating Rate Bond UCITS ETF
- iShares € Covered Bond UCITS ETF


