Talking Points:
- 3 Possible Scenarios on NZD/CAD Weekly Chart
- Pending Retest of Daily Uptrend Line
- The Ideal Time Frame for Taking This Trade
By and large, it is not a good idea to fight a higher time frame's effects. This is especially true when that higher time frame is the weekly. However, there may soon be a case for doing precisely that in NZDCAD.
The weekly chart below shows three bearish pin bars, which reflect a period of relief amidst a strongly trending backdrop. It may well be possible that a deeper pullback is due, but when the market shows three consecutive pin bars without actually going anywhere, as has been the case here, it may just as easily indicate simple indecision and consolidation.
Guest Commentary: 3 Straight Weekly Pin Bars for NZD/CAD

From current levels, prices on the weekly chart may now:
- Simply move sideways for a week or two more, in which case there are at least 300 pips or more remaining to the upside;
- Actually produce a fake downside signal while preparing to continue the upward move up, in which case there is even more upside than 300 pips; or…
- Begin a slow breakdown.
Of these three scenarios, only the third is unfavorable for long trades. Although pin bars are one of the combinations that may well temporarily (or permanently) halt runaway trends, a set of three going nowhere simply does not inspire conviction in a deeper pullback at this point.
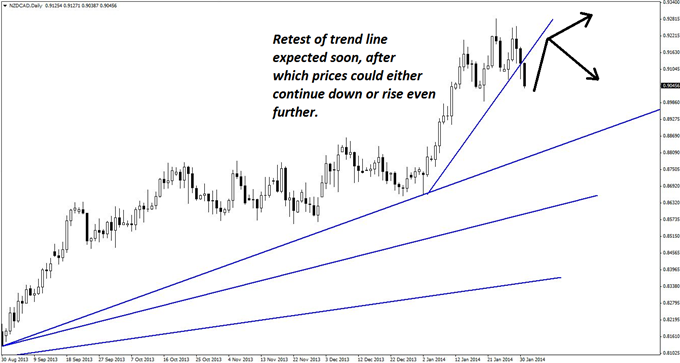
The daily chart below presents an array of rising trend lines, one of which has just been broken. A retest should be expected soon, as shown. After that retest, prices may continue to rise (perhaps even more steeply than shown) but could continue lower as well. Either way, there is plenty of room for a lower-time-frame trade that goes in the direction of the overall trend.
Guest Commentary: Pending Re-test of Daily NZD/CAD Trend Line
Support can be determined on the below four-hour chart, which uses the pin bars to the left of price as well as the body of the long, white candlestick to isolate the key support zone. The candlestick, in particular, offers some assurance of strength in that zone and has previously done well to reverse the movement of price. Although a harmonic pattern of some kind (ex. Gartley pattern) is also in progress, it is less clear, and for that reason, the initial interpretation is preferred.
Guest Commentary: Key Support Zone for Initiating NZD/CAD Longs
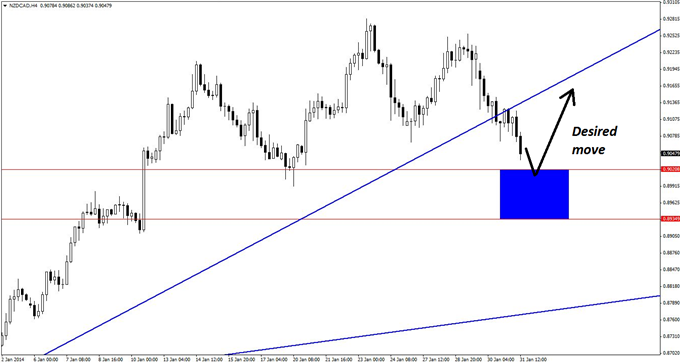
The support zone has been estimated as 0.8934-0.9020, which is a range of 86 pips. Meanwhile, the trade could run at least 140 pips just to reach the underside of the trend line. Thus, the risk profile for this trade is better than 1:1, even if this is traded as a pure support trade.
However, given that precision and confirmation are so valuable, it is better to initiate this trade on the hourly chart (not shown). There, a pin bar, bullish engulfing pattern, and/or bullish reversal divergence will likely yield stop losses in the 20- to 30-pip range, making the overall risk profile that much more attractive.
Of course, this means that traders should be prepared to take two or three attempts at the entry, but the tighter stop should make the hourly trade preferable to one on the four-hour chart.
By Kaye Lee, private fund trader and head trader consultant, StraightTalkTrading.com
original source


