Talking Points:
- US Dollar Perched at Two-Month Rising Trend Support
- S&P 500 Edges to the Bottom of Familiar Price Range
- Crude Oil Targeting Above $98.00 as Rally Continues
Can’t access to the Dow Jones FXCM US Dollar Index? Try the USD basket on Mirror Trader. **
US DOLLAR TECHNICAL ANALYSIS – Prices are testing support in the 10651-61 area, marked by the bottom of a rising channel set from November and the 23.6% Fibonacci retracement. A break lower initially targets the 38.2% level at 10602. Alternatively, a turn back above resistance at 10718 – a horizontal pivot – eyes the 10756-73 region (January 21 high, rising channel top).
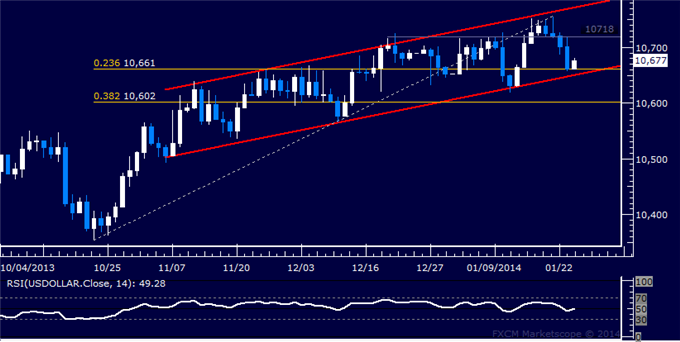
Daily Chart - Created Using FXCM Marketscope 2.0
** The Dow Jones FXCM US Dollar Index and the Mirror Trader USD basket are not the same product.
S&P 500 TECHNICAL ANALYSIS – Prices are testing resistance in the 1844.90-49.10 area, marked by the December 31 high and the 14.6% Fibonacci expansion. A break higher exposes the 23.6% level at 1863.10. Near-term support is at 1819.60, the 14.6% Fib retracement, with a move below that targeting the 23.6% threshold at 1801.40.
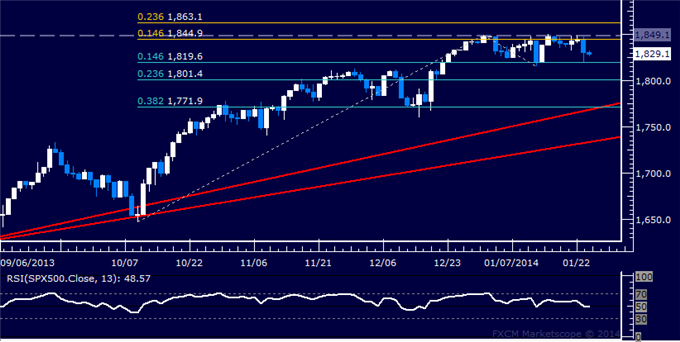
Daily Chart - Created Using FXCM Marketscope 2.0
GOLD TECHNICAL ANALYSIS – Prices are testing resistance in the 1263.19-67.71 area, marked by the top of a rising channel, a former support level dating back to October, and the 38.2% Fibonacci expansion. A break higher targets the 50% and 61.8% Fibs at 1272.99 and 1282.80, respectively. Channel support is now at 1233.20.
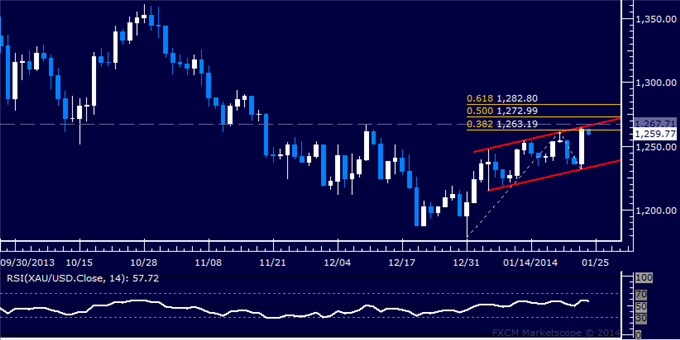
Daily Chart - Created Using FXCM Marketscope 2.0
CRUDE OIL TECHNICAL ANALYSIS – Prices pushed higher as expected after putting in a bullish Piercing Line candlestick pattern. Buyers now aim to challenge 97.48, the 76.4% Fibonacci expansion, with a break above that targeting the December 27 high at 100.73. Reversing back below the 61.8% level at 97.09 exposes the 50% Fib at 95.97.
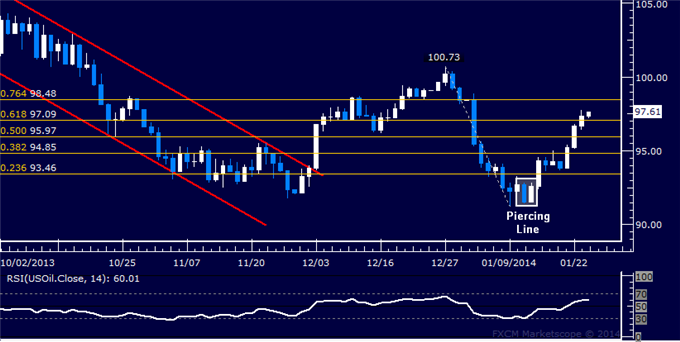
Daily Chart - Created Using FXCM Marketscope 2.0
--- Written by Ilya Spivak, Currency Strategist for DailyFX.com
To receive Ilya's analysis directly via email, please SIGN UP HERE
Contact and follow Ilya on Twitter: @IlyaSpivak
original source


