Talking Points:
- Changing Fundamental Picture for USD/NOK
- Multiple Technical Patterns in Play
- Long Trade Idea for USD/NOK
The Norwegian krone (NOK) has found support of late as a result of a more hawkish outlook and comments from the Norges Bank at its most recent policy meeting. Both housing prices and underlying inflation in Norway have been better than expected, which reflects some surprising strength in the nation’s economy. This will most likely reduce the downside risk to economic growth and also support a stronger NOK and higher path to interest rates.
However, the question now is whether the current NOK strength will continue, or if we will see a weakening against the US dollar (USD) in upcoming weeks and months. What is certain is that a stronger NOK is not especially favorable to the nation’s export industry and overall risk appetite in Norway. This was not the case in early 2014, when weaker currency conditions prevailed.
See also: USD/NOK: The Case for a Comeback
Furthermore, we also have an interesting technical pattern in USDNOK, which can be described as a falling wedge reversal formation. The falling wedge is a bullish pattern that begins at the top and contracts as prices move lower. This price action forms a cone that slopes down as the reaction highs and reaction lows converge, causing lower highs and lower lows.
Guest Commentary: Technical Outlook for USD/NOK
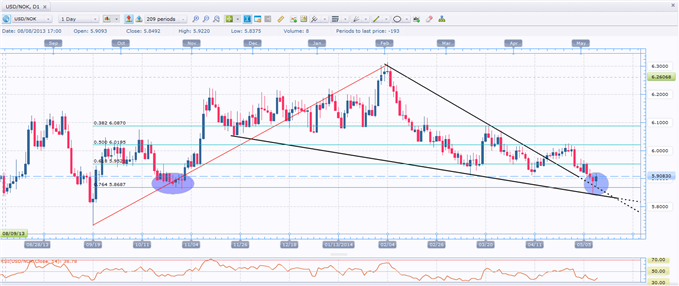
Support: 5.85, 5.80, and 5.75
Resistance: 6.00, 6.03- 6.05, 6.10, 6.15, and 6.25
USDNOK has (so far) reacted very positively after testing the support area around 5.85. The pair posted a bullish hammer candlestick as part of an up day the following trading day. As long as the current low just above 5.85 holds throughout upcoming days and weeks, we should see some retracement of the current downtrend.
Besides the bullish hammer candlestick, we also have a reversal pattern within the falling wedge formation. This comes after an extended downtrend (since February this year) and most likely marks the final low. After the trend line breakout in early April, we have seen a pullback to 5.90 and a massive ‘’shake out’’ of possible weak hands below that price point before ultimately ending the day at the upper range as part of the bullish hammer candlestick.
Furthermore, we noticed a positive Relative Strength Index (RSI) divergence against price, as USDNOK has moved lower and the RSI has failed to set a new low. Along with the bullish hammer and the falling wedge formations, we should, at current levels, see a greater likelihood for a move up in USDNOK in upcoming days and weeks.
The key levels on the upside are 6.00, 6.05, and 6.15. On the downside, we have now established great support at 5.85 as well as at earlier levels at 5.80 and 5.75.
Long Trade Idea for USD/NOK
Using half the desired position, go long USDNOK at current levels (between 5.88 and 5.92). Add to the position if we see a new test of 5.85.
The stop loss should be executed if USDNOK closes below 5.80 on the daily time frame. Key price targets for this trade would be 6.05 and 6.13.
By Rafiul Hossain, Guest Contributor, DailyFX.com
original source


